The goal of vmeasur is to quantify the contractile nature of vessels monitored under an operating microscope.
You can install the released version of vmeasur from CRAN with:
install.packages("vmeasur")And the development version from GitHub with:
# install.packages("devtools")
devtools::install_github("JamesHucklesby/vmeasur")To calibrate an operating microscope, take an image of a gradiated ruler. You can then use this function to calculate the number of pixels per mm.
calibrate_pixel_size()Once video data is collected, the region of interest can be selected using select_roi. This provides a wizard that will assist the user through image analysis.
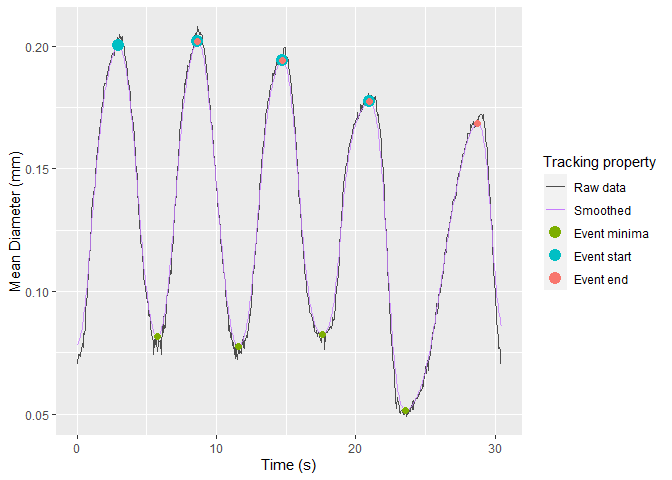
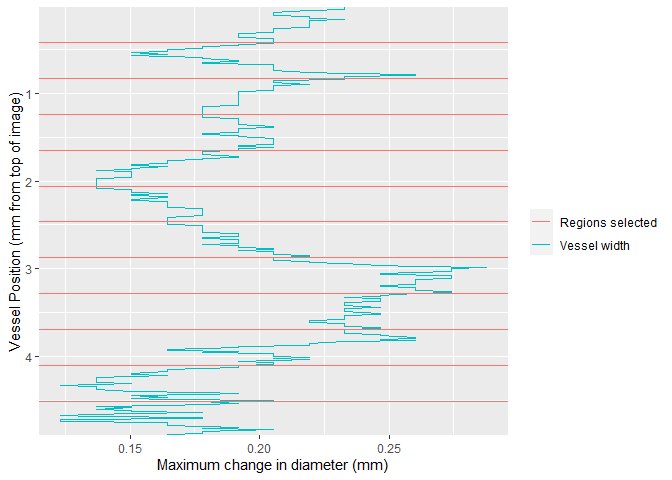
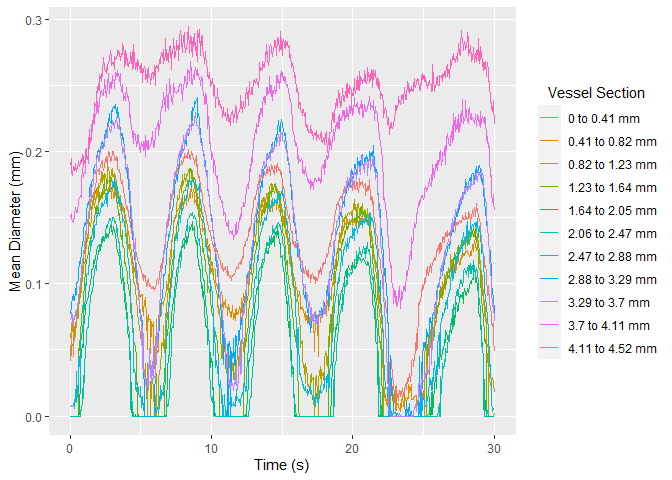
select_roi()Once selected, vmeasur can output a variety of important parameters and graphs
#> # A tibble: 4 x 12
#> # Rowwise:
#>   event_maxima event_start event_end type     start_value end_value max_value
#>          <dbl>       <dbl>     <dbl> <chr>          <dbl>     <dbl>     <dbl>
#> 1          531         472       647 contract        12.9      12.3      3.76
#> 2          261         195       331 contract        14.7      14.2      5.67
#> 3          130          67       195 contract        14.6      14.7      5.95
#> 4          396         331       472 contract        14.2      12.9      6.02
#> # ... with 5 more variables: baseline_change <dbl>, event_duration <dbl>,
#> #   cont_duration <dbl>, fill_duration <dbl>, event_gradient <dbl>
#> # A tibble: 6 x 4
#>   variable   mean      sd overall
#>   <chr>     <dbl>   <dbl> <chr>
#> 1 CA       0.12   0.00645 0.12 (0.006448)
#> 2 CD       2.77   0.136   2.774 (0.1358)
#> 3 CS       0.0434 0.00390 0.04337 (0.003905)
#> 4 ED       6.36   0.908   6.36 (0.9081)
#> 5 EDD      0.193  0.0112  0.1932 (0.0112)
#> 6 EDD2     0.185  0.0152  0.1854 (0.01517)
#>   X.1 y p_width excluded filename
#> 1   1 1       0    FALSE        1
#> 2   2 2       0    FALSE        1
#> 3   3 3       0    FALSE        1
#> 4   4 4       0    FALSE        1
#> 5   5 5       0    FALSE        1
#> 6   6 6       0    FALSE        1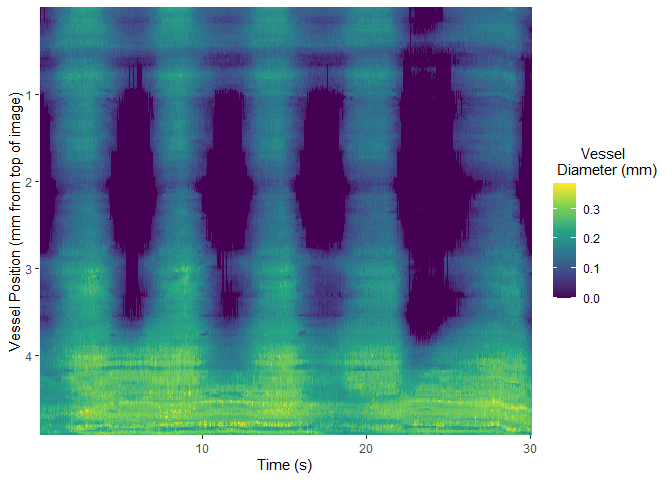
#> # A tibble: 6 x 15
#> # Groups:   source_file [6]
#>   ygroup event_maxima event_start event_end type     start_value end_value
#>   <chr>         <dbl>       <dbl>     <dbl> <chr>          <dbl>     <dbl>
#> 1 3               134          62       192 contract       13.2      13.2
#> 2 4               130          62       193 contract       12.6      12.7
#> 3 2               136          63       193 contract       12.3      12.1
#> 4 5               128          63       194 contract        9.97      9.88
#> 5 1               132          65       191 contract       14.2      14.2
#> 6 6               129          66       196 contract       10.5      10.6
#> # ... with 8 more variables: max_value <dbl>, baseline_change <dbl>,
#> #   event_duration <dbl>, cont_duration <dbl>, fill_duration <dbl>,
#> #   event_gradient <dbl>, source_file <dbl>, cont_id <int>
#> # A tibble: 6 x 5
#>   ygroup variable   mean      sd overall
#>   <chr>  <chr>     <dbl>   <dbl> <chr>
#> 1 1      CA       0.104  0.0345  0.1038 (0.03449)
#> 2 1      CD       2.96   0.0913  2.961 (0.0913)
#> 3 1      CS       0.0349 0.0105  0.03486 (0.01051)
#> 4 1      ED       6.38   1.14    6.382 (1.145)
#> 5 1      EDD      0.188  0.00948 0.1875 (0.009478)
#> 6 1      EDD2     0.177  0.0190  0.1768 (0.01904)