
This is an R package for working with data resulting from grapheme-color synesthesia-related consistency tests. synr provides tools for exploring test data, including visualizing a single participant’s data, and applying summarizing functions such as calculating color variation/consistency scores or classifying participant data as valid or invalid.
synr is available on CRAN, meaning you can simply:
install.packages('synr')Note that this will also install packages that synr depends on unless
you already have them (dbscan, data.table and
ggplot2).
Once data are in an appropriately formatted data frame/tibble (‘long
format’ - see vignettes for more information), everything starts with
rolling up participant data into a ‘ParticipantGroup’ object with
create_participantgroup_widedata:
library(synr)

pgroup <- create_participantgroup(
    formatted_df, # data frame/tibble to use, with data in 'long format'
    n_trials_per_grapheme=3, # number of trials that grapheme was used for
    participant_col_name="participant_id", # name of column which holds participant ID's
    symbol_col_name='symbol', # name of column which holds grapheme symbol strings
    color_col_name='color', # rname of column which holds response color HEX codes
    color_space_spec = "Luv" # color space to use for all calculations with participant group
)
Using the resulting object (pgroup), you can call
various methods. A few examples follow.
pgroup$get_mean_consistency_scores(symbol_filter=LETTERS)
would return a vector of CIELUV-based consistency
scores, using only data from trials involving capital letters.
pgroup$check_valid_get_twcv_scores(symbol_filter=0:9)
would return a data frame which describes classifications of all
participant data, where each data set is classified as ‘invalid’ or
‘valid’, based largely on DBSCAN clustering. This
may be used to identify participants who varied their responses too
little, e. g. by responding with an orange color on every trial.
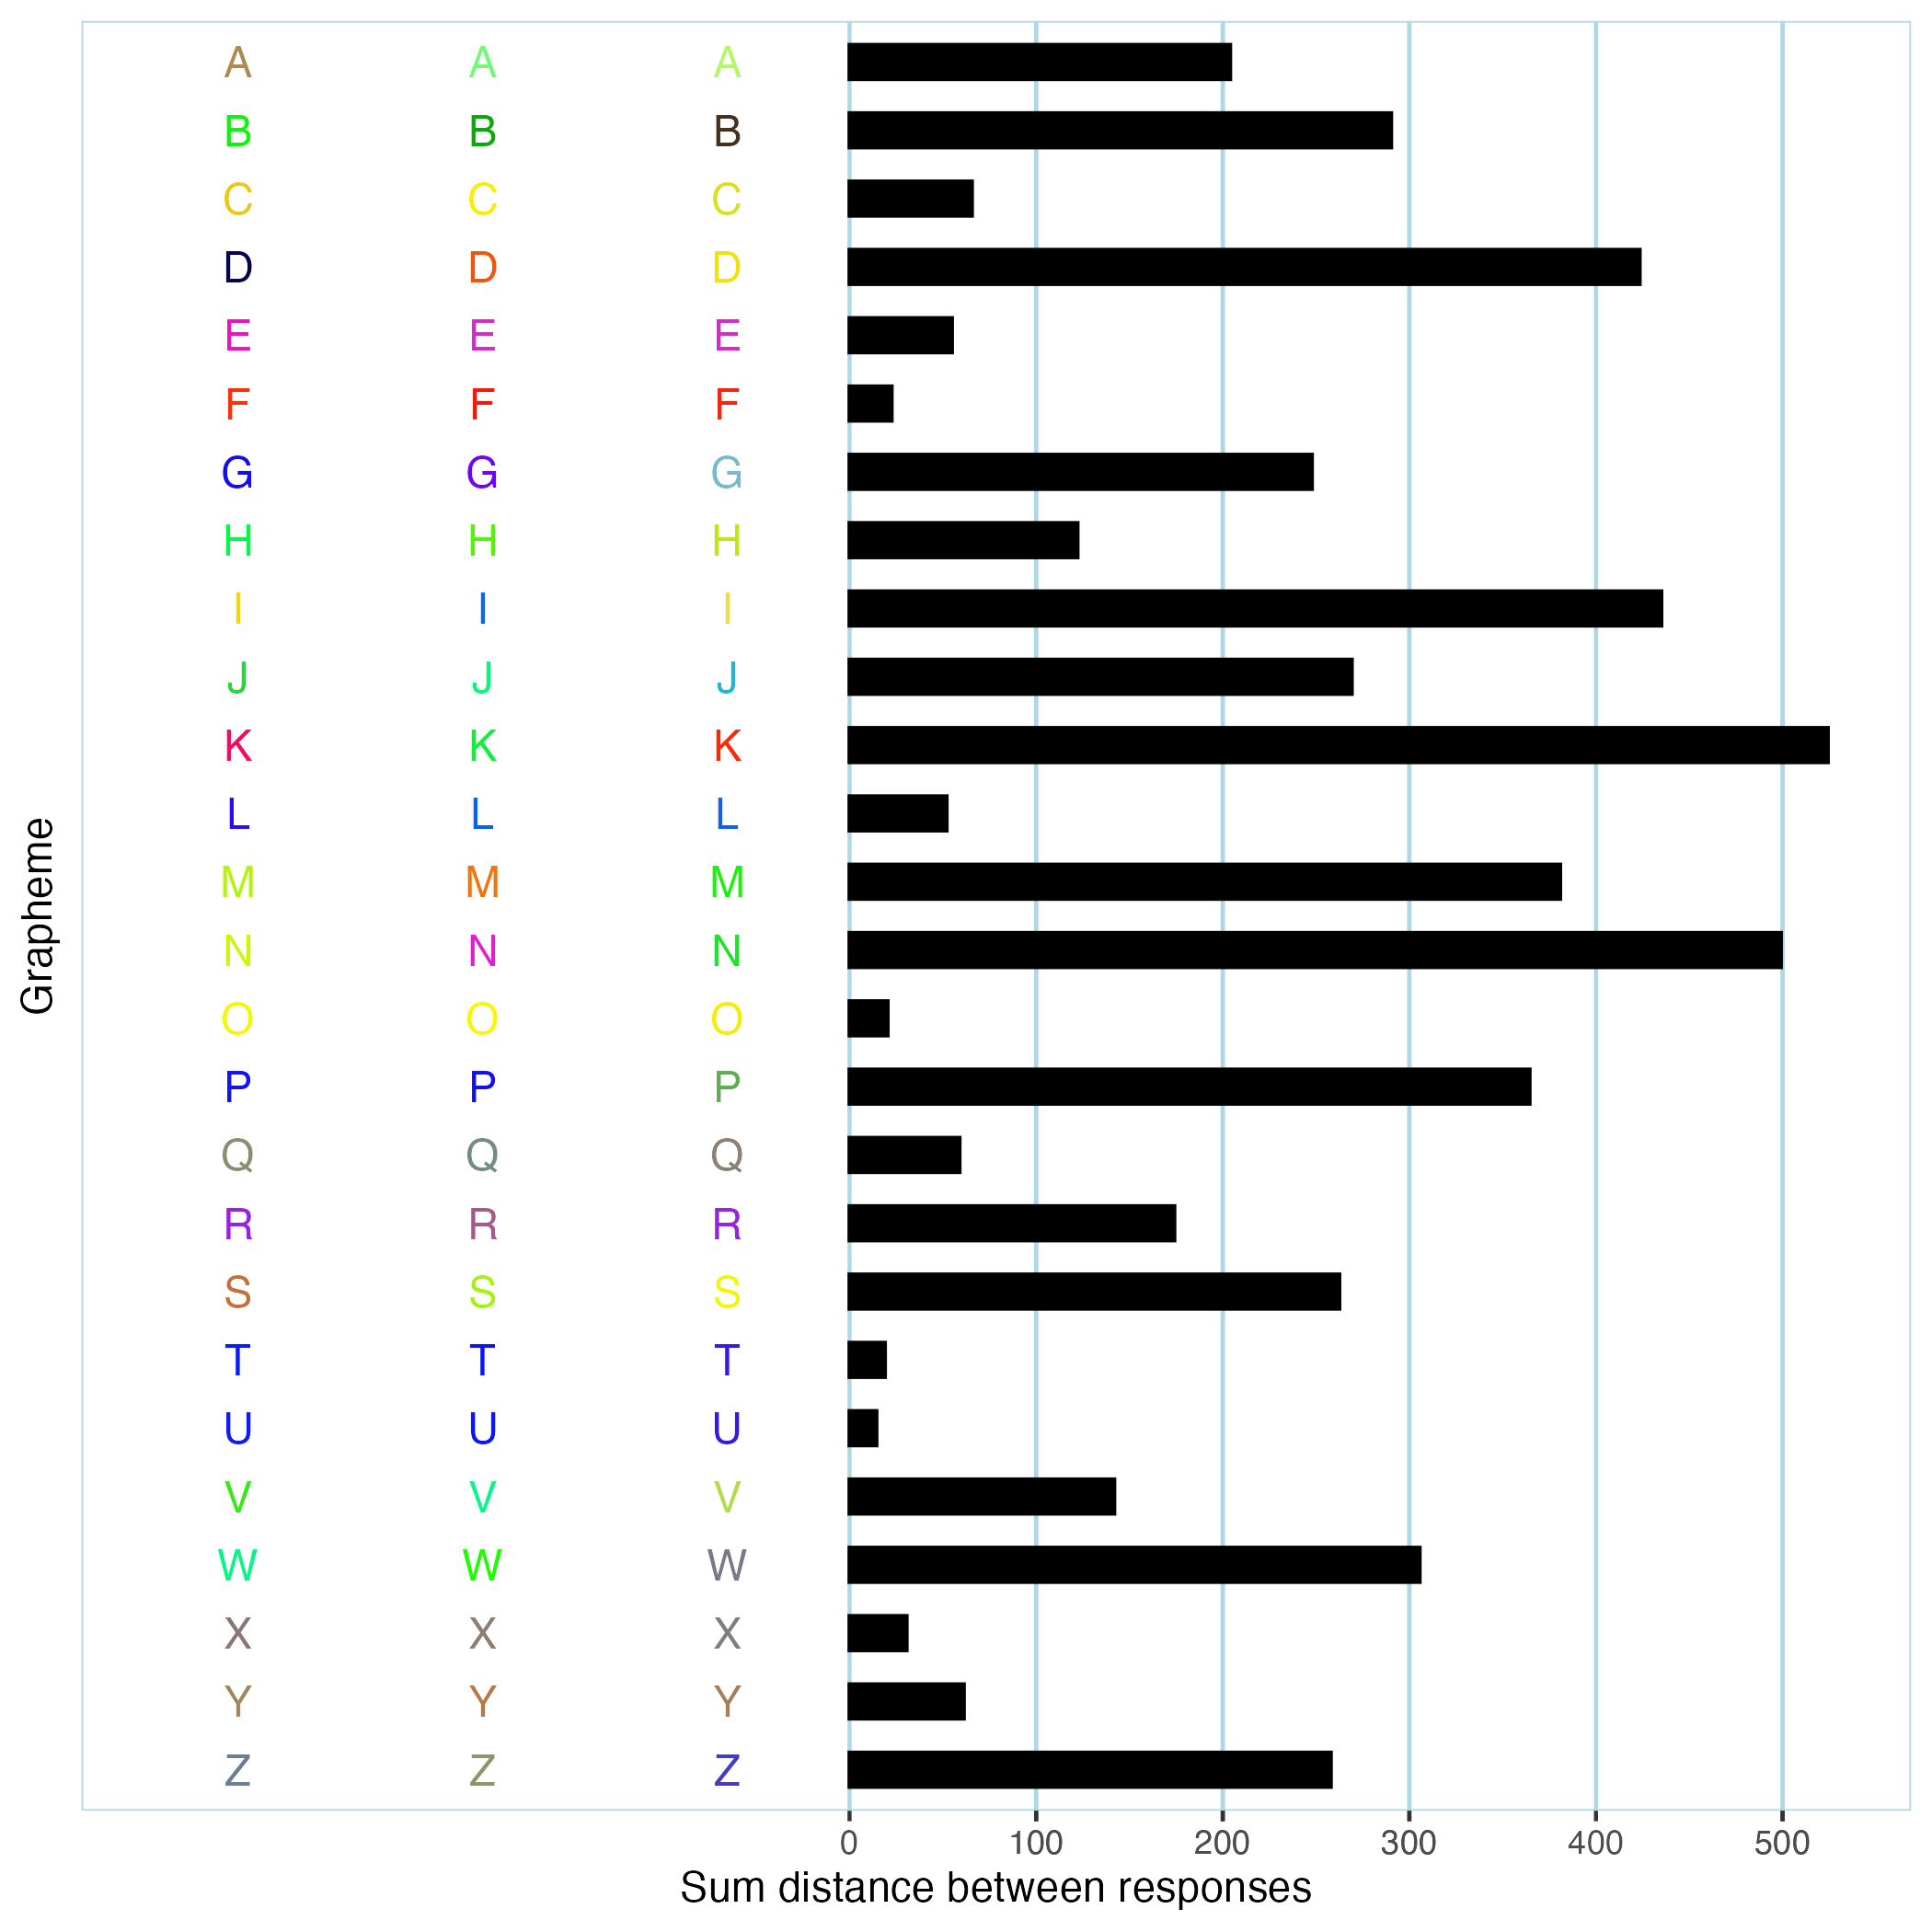
pgroup$participants[[1]]$get_plot(symbol_filter=LETTERS)
would produce a bar plot of per-grapheme consistency scores for a single
participant, using only data from trials involving capital letters. You
can see an example below.
More details on required data format and how to use the above
functions and more can be found in the package’s
vignettes, some of which are also included in the package itself
(run help(synr) to find them). Additional information is
available in the following article:
Wilsson, L., van Leeuwen, T.M. & Neufeld, J. synr: An R package for handling synesthesia consistency test data. Behav Res 55, 4086–4098 (2023). https://doi.org/10.3758/s13428-022-02007-y
If you have any suggestions on improvements you are very welcome to directly raise issues or commit code improvements to the github repository at https://github.com/datalowe/synr.