![]()
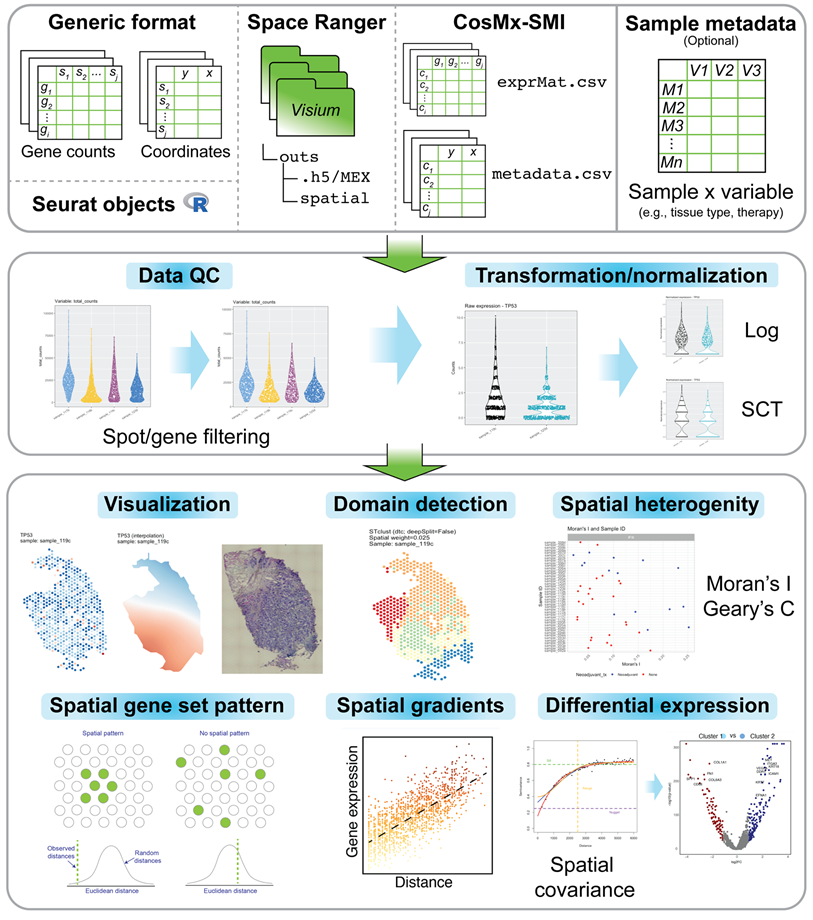
An R package for the visualization and analysis of spatially-resolved transcriptomics data, such as those generated with 10X Visium. The spatialGE package features a data object (STlist: Spatial Transctiptomics List) to store data and results from multiple tissue sections, as well as associated analytical methods for:
STplot, gene_interpolation,
STplot_interpolation to explore gene expression in spatial
context.SThet,
compare_SThet to assess the level of spatial uniformity in
gene expression by calculating Moran’s I and/or Geary’s C and
qualitatively explore correlations with sample-level metadata (i.e.,
tissue type, therapy, disease status).STclust to perform
spatially-informed hierarchical clustering for prediction of tissue
domains in samples.STenrich to detect gene
sets with indications of spatial patterns (i.e., non-spatially uniform
gene set expression).STgradient to detect
genes with evidence of variation in expression with respect to a tissue
domain.STdiff to
test for differentially expressed genes using mixed models with spatial
covariance structures to account of spatial dependency among
spots/cells. It also supports non-spatial tests (Wilcoxon’s and
T-test).The methods in the initial spatialGE release, technical details, and
their utility are presented in this publication:
https://doi.org/10.1093/bioinformatics/btac145. For details on the
recently developed methods STenrich,
STgradient, and STdiff please refer to the
spatialGE documentation.
The spatialGE repository is available at GitHub and can
be installed via devtools.
options(timeout=9999999) # To avoid R closing connection with GitHub
devtools::install_github("fridleylab/spatialGE")For tutorials on how to use spatialGE, please go to:
https://fridleylab.github.io/spatialGE/
The code for spatialGE can be found here:
https://github.com/FridleyLab/spatialGE
A point-and-click web application that allows using spatialGE without coding/scripting is available at https://spatialge.moffitt.org . The web app currently supports Visium outputs and csv/tsv gene expression files paired with csv/tsv coordinate files.
When using spatialGE, please cite the following publication:
Ospina, O. E., Wilson C. M., Soupir, A. C., Berglund, A. Smalley, I., Tsai, K. Y., Fridley, B. L. 2022. spatialGE: quantification and visualization of the tumor microenvironment heterogeneity using spatial transcriptomics. Bioinformatics, 38:2645-2647. https://doi.org/10.1093/bioinformatics/btac145
