![]()
![]()

The scoringutils package facilitates the process of
evaluating forecasts in R, using a convenient and flexible
data.table-based framework. It provides broad functionality
to check the input data and diagnose issues, to visualise forecasts and
missing data, to transform data before scoring, to handle missing
forecasts, to aggregate scores, and to visualise the results of the
evaluation. The package is easily extendable, meaning that users can
supply their own scoring rules or extend existing classes to handle new
types of forecasts.
The package underwent a major re-write. The most comprehensive
documentation for the updated package is the revised
version of our original
scoringutils paper.
Another good starting point are the vignettes Details on the metrics implemented and Scoring forecasts directly.
For further details on the specific issue of transforming forecasts for scoring see:
Nikos I. Bosse, Sam Abbott, Anne Cori, Edwin van Leeuwen, Johannes Bracher* and Sebastian Funk* (*: equal contribution) (2023).
Scoring epidemiological forecasts on transformed scales, PLoS Comput Biol 19(8): e1011393 https://doi.org/10.1371/journal.pcbi.1011393
Install the CRAN version of this package using
install.packages("scoringutils")Install the unstable development version from GitHub using
remotes::install_github("epiforecasts/scoringutils", dependencies = TRUE)scoringutils currently supports scoring the following
forecast types:
binary: a probability for a binary (yes/no) outcome
variable.point: a forecast for a continuous or discrete outcome
variable that is represented by a single number.quantile: a probabilistic forecast for a continuous or
discrete outcome variable, with the forecast distribution represented by
a set of predictive quantiles.sample: a probabilistic forecast for a continuous or
discrete outcome variable, with the forecast represented by a finite set
of samples drawn from the predictive distribution.nominal categorical forecast with unordered outcome
possibilities (generalisation of binary forecasts to multiple
outcomes)The expected input format is generally a data.frame (or
similar) with required columns observed, and
predicted that holds the forecasts and observed values.
Exact requirements depend on the forecast type. For more information,
have a look at the paper,
call ?as_forecast_binary,
?as_forecast_quantile etc., or have a look at the example
data provided in the package (example_binary,
example_point, example_quantile,
example_sample_continuous,
example_sample_discrete, example_nominal).
Before scoring, input data needs to be validated and transformed into
a forecast object using one of the
as_forecast_<type>() functions.
forecast_quantile <- example_quantile |>
  as_forecast_quantile(
    forecast_unit = c(
      "location", "forecast_date", "target_end_date", "target_type", "model", "horizon"
    )
  )
#> ℹ Some rows containing NA values may be removed. This is fine if not
#>   unexpected.

print(forecast_quantile, 2)
#> Forecast type: quantile
#> Forecast unit:
#> location, forecast_date, target_end_date, target_type, model, and horizon
#>
#> Key: <location, target_end_date, target_type>
#>        observed quantile_level predicted location forecast_date target_end_date
#>           <num>          <num>     <int>   <char>        <Date>          <Date>
#>     1:   127300             NA        NA       DE          <NA>      2021-01-02
#>     2:     4534             NA        NA       DE          <NA>      2021-01-02
#>    ---
#> 20544:       78          0.975       611       IT    2021-07-12      2021-07-24
#> 20545:       78          0.990       719       IT    2021-07-12      2021-07-24
#>        target_type                model horizon
#>             <char>               <char>   <num>
#>     1:       Cases                 <NA>      NA
#>     2:      Deaths                 <NA>      NA
#>    ---
#> 20544:      Deaths epiforecasts-EpiNow2       2
#> 20545: Deaths epiforecasts-EpiNow2 2For quantile-based and sample-based forecasts, a single prediction is
represented by a set of several quantiles (or samples) from the
predictive distribution, i.e. several rows in the input data.
scoringutils therefore needs to group rows together that
form a single forecast. scoringutils uses all other
existing columns in the input data to achieve this - the values in all
other columns should uniquely identify a single forecast. Additional
columns unrelated to the forecast unit can mess this up. The
forecast_unit argument in
as_forecast_<type>() makes sure that only those
columns are retained which are relevant for defining the unit of a
single forecast.
Forecasts can be scored by calling score() on a
validated forecast object.
scores <- forecast_quantile |>
  score()
score() takes an additional argument,
metrics, with a list of scoring rules. Every forecast type
has a default list of metrics. You can easily add your own scoring
functions, as long as they conform with the format for that forecast
type. See the paper
for more information.
You can summarise scores using the function
summarise_scores(). The by argument is used to
specify the desired level of summary. fun let’s you specify
any summary function, although it is recommended to stick to the mean as
a primary summary function, as other functions can lead to improper
scores.
scores |>
  summarise_scores(by = c("model", "target_type")) |>
  summarise_scores(by = c("model", "target_type"), fun = signif, digits = 3)
#>                    model target_type     wis overprediction underprediction
#>                   <char>      <char>   <num>          <num>           <num>
#> 1: EuroCOVIDhub-ensemble       Cases 17900.0       10000.00          4240.0
#> 2: EuroCOVIDhub-baseline       Cases 28500.0       14100.00         10300.0
#> 3:  epiforecasts-EpiNow2       Cases 20800.0       11900.00          3260.0
#> 4: EuroCOVIDhub-ensemble      Deaths    41.4           7.14             4.1
#> 5: EuroCOVIDhub-baseline      Deaths   159.0          65.90             2.1
#> 6:       UMass-MechBayes      Deaths    52.7           8.98            16.8
#> 7:  epiforecasts-EpiNow2      Deaths    66.6          18.90            15.9
#>    dispersion     bias interval_coverage_50 interval_coverage_90 ae_median
#>         <num>    <num>                <num>                <num>     <num>
#> 1:     3660.0 -0.05640                0.391                0.805   24100.0
#> 2:     4100.0  0.09800                0.328                0.820   38500.0
#> 3:     5660.0 -0.07890                0.469                0.789   27900.0
#> 4:       30.2  0.07270                0.875                1.000      53.1
#> 5:       91.4  0.33900                0.664                1.000     233.0
#> 6:       26.9 -0.02230                0.461                0.875      78.5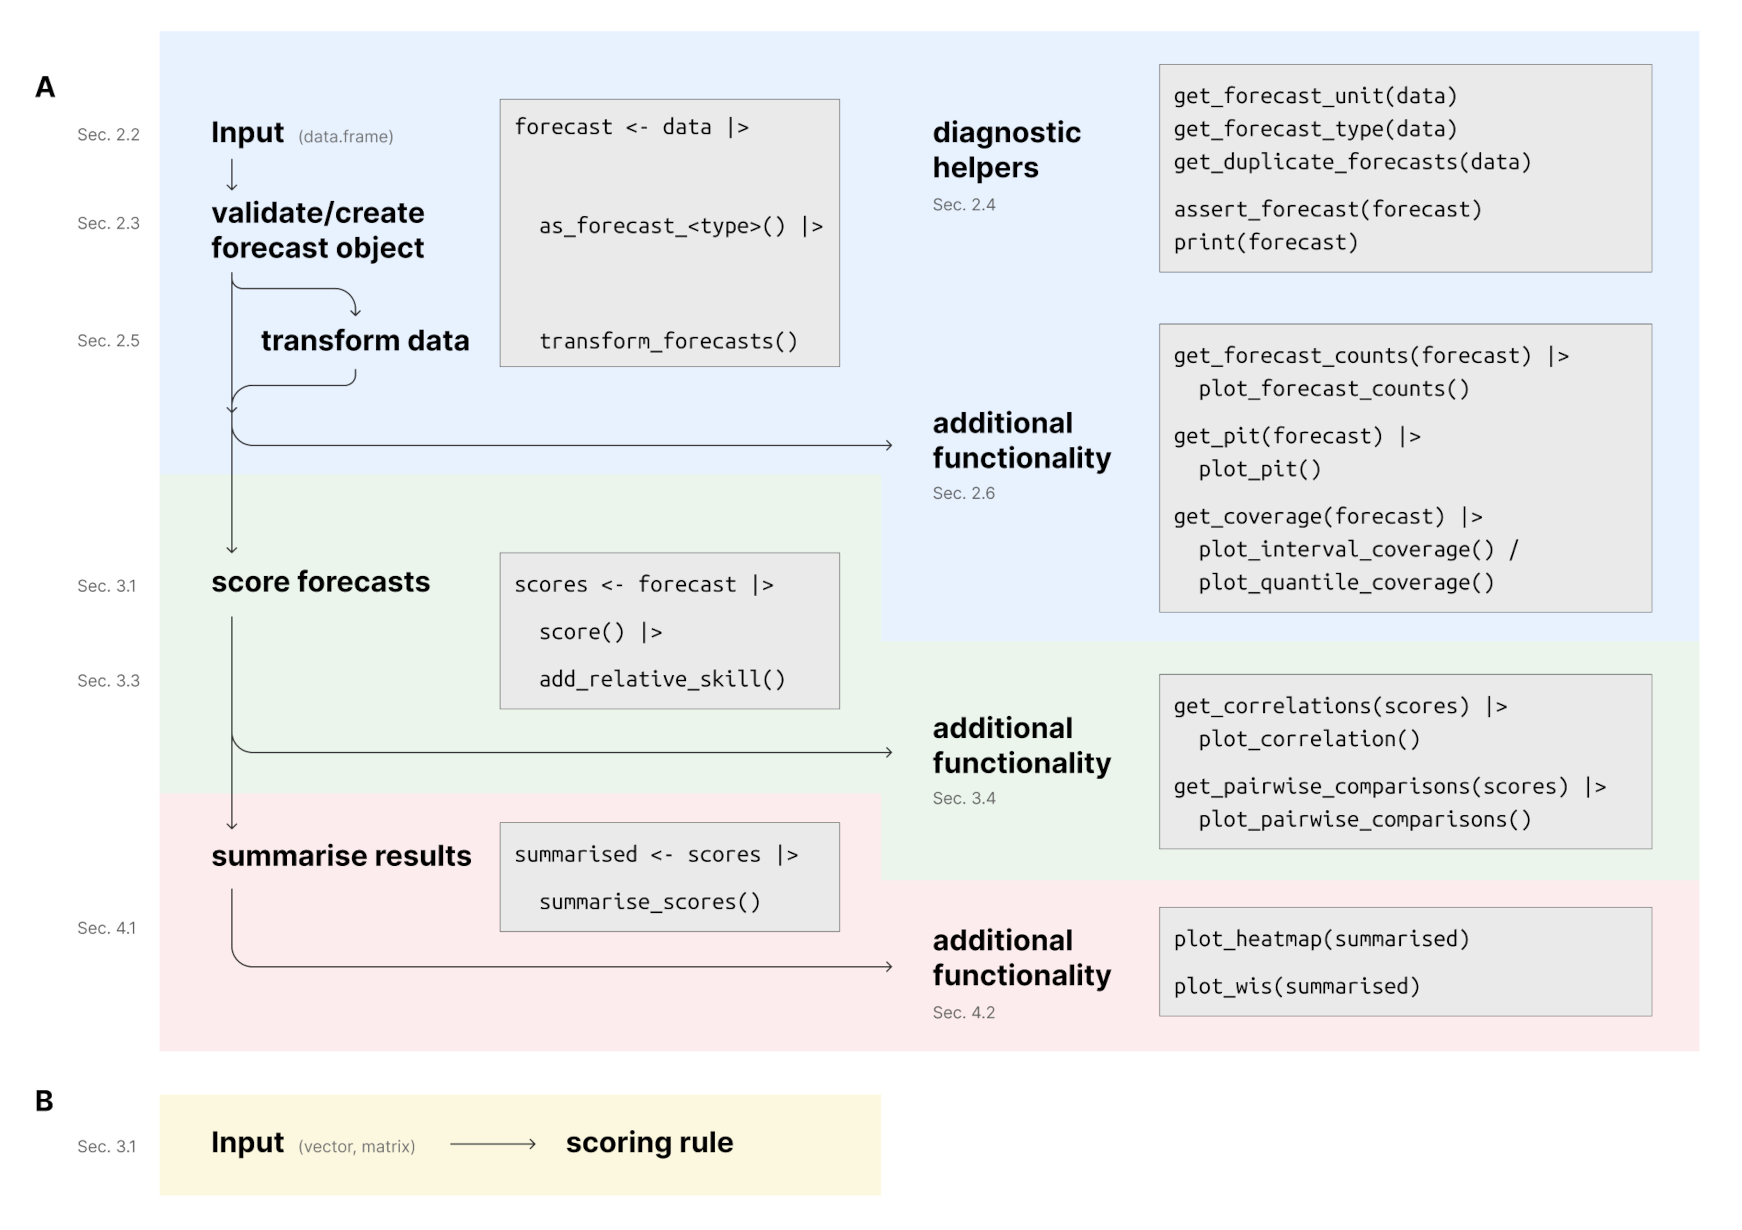
#> 7: 31.9 -0.00513 0.420 0.908 105.0The following depicts the suggested workflow for evaluating forecasts
with scoringutils (sections refer to the paper). Please
find more information in the paper,
the function documentation and the vignettes.
If you are using scoringutils in your work please
consider citing it using the output of
citation("scoringutils") (or
print(citation("scoringutils"), bibtex = TRUE)):
#> To cite scoringutils in publications use the following. If you use the
#> CRPS, DSS, or Log Score, please also cite scoringRules.
#>
#>   Nikos I. Bosse, Hugo Gruson, Sebastian Funk, Anne Cori, Edwin van
#>   Leeuwen, and Sam Abbott (2022). Evaluating Forecasts with
#>   scoringutils in R, arXiv. DOI: 10.48550/ARXIV.2205.07090
#>
#> To cite scoringRules in publications use:
#>
#>   Alexander Jordan, Fabian Krueger, Sebastian Lerch (2019). Evaluating
#>   Probabilistic Forecasts with scoringRules. Journal of Statistical
#>   Software, 90(12), 1-37. DOI 10.18637/jss.v090.i12
#>
#> To see these entries in BibTeX format, use 'print(<citation>,
#> bibtex=TRUE)', 'toBibtex(.)', or set
#> 'options(citation.bibtex.max=999)'.Please briefly describe your problem and what output you expect in an issue. If you have a question, please don’t open an issue. Instead, ask on our Q and A page.
We welcome contributions and new contributors! We particularly appreciate help on priority problems in the issues. Please check and add to the issues, and/or add a pull request.
Please note that the scoringutils project is released
with a Contributor
Code of Conduct. By contributing to this project, you agree to abide
by its terms.
The development of scoringutils was funded via the
Health Protection Research Unit (grant code NIHR200908) and the Wellcome
Trust (grant: 210758/Z/18/Z). This work has also been supported by the
US National Institutes of General Medical Sciences (R35GM119582). The
content is solely the responsibility of the authors and does not
necessarily represent the official views of NIGMS, or the National
Institutes of Health.
All contributions to this project are gratefully acknowledged using
the allcontributors
package following the all-contributors specification.
Contributions of any kind are welcome!
nikosbosse, seabbs, sbfnk, jamesmbaazam, Bisaloo, actions-user, toshiakiasakura, MichaelChirico, jcken95, athowes, nickreich, damonbayer, seabbs-bot
DavideMagno, mbojan, jhellewell14, dshemetov, elray1, jonathonmellor, dylanhmorris, annakrystalli, robchallen, teunbrand, RokGrah, zsusswein