![]()
{rutledge} is an R data package that provides real-time
PCR raw fluorescence data by Rutledge et al. (2004) in tidy format.
The eponymous data set rutledge comprises a six-point,
ten-fold dilution series repeated in 5 independent runs. In each run,
for each concentration there are four replicates. Of a total of 240
amplification curves, 212 curves are 45 cycles long and 28 curves are 35
cycles long only. The data is for two targets (amplicons): K1/K2, 102
bp, and K3/K2, 218 bp.
Install {rutledge} from CRAN:
# Install from CRAN
install.packages("rutledge")
You can install the development version of {rutledge}
like so:
# install.packages("remotes")
remotes::install_github("ramiromagno/rutledge")rutledge is provided as a tidy data set, in long format,
i.e. each row is for an amplication curve point (cycle/fluor).
library(rutledge)
rutledge
#> # A tibble: 10,800 × 10
#>    plate well  dye   target sample_type replicate   copies dilution cycle  fluor
#>    <fct> <fct> <chr> <fct>  <fct>           <int>    <int>    <int> <dbl>  <dbl>
#>  1 1     <NA>  SYBR  K1/K2  std                 1 41700000        1     1 0
#>  2 1     <NA>  SYBR  K1/K2  std                 1 41700000        1     2 0
#>  3 1     <NA>  SYBR  K1/K2  std                 1 41700000        1     3 0
#>  4 1     <NA>  SYBR  K1/K2  std                 1 41700000        1     4 0
#>  5 1     <NA>  SYBR  K1/K2  std                 1 41700000        1     5 0.0007
#>  6 1     <NA>  SYBR  K1/K2  std                 1 41700000        1     6 0.0022
#>  7 1     <NA>  SYBR  K1/K2  std                 1 41700000        1     7 0.0005
#>  8 1     <NA>  SYBR  K1/K2  std                 1 41700000        1     8 0.0047
#>  9 1     <NA>  SYBR  K1/K2  std                 1 41700000        1     9 0.0107
#> 10 1     <NA>  SYBR  K1/K2  std                 1 41700000        1    10 0.0203
#> # ℹ 10,790 more rows
The rutledge data set comprises 240 amplification
curves: 2 amplicons \(\times\) 5 runs
(plates) \(\times\) 6 dilution levels
\(\times\) 4 replicates.
rutledge |>
  dplyr::count(plate, target, copies, replicate)
#> # A tibble: 240 × 5
#>    plate target copies replicate     n
#>    <fct> <fct>   <int>     <int> <int>
#>  1 1     K1/K2     417         1    45
#>  2 1     K1/K2     417         2    45
#>  3 1     K1/K2     417         3    45
#>  4 1     K1/K2     417         4    45
#>  5 1     K1/K2    4170         1    45
#>  6 1     K1/K2    4170         2    45
#>  7 1     K1/K2    4170         3    45
#>  8 1     K1/K2    4170         4    45
#>  9 1     K1/K2   41700         1    45
#> 10 1     K1/K2   41700         2    45
#> # ℹ 230 more rows

rutledge |>
  ggplot(mapping = aes(
    x = cycle,
    y = fluor,
    group = interaction(plate, target, copies, replicate),
    col = as.character(copies)
  )) +
  geom_line(linewidth = 0.2) +
  geom_point(size = 0.2) +
  labs(y = "Raw fluorescence", colour = "No. of copies", title = "Six-point 10-fold dilution series") +
  guides(color = guide_legend(override.aes = list(linewidth = 0.5), reverse = TRUE)) +
  facet_grid(rows = vars(plate), cols = vars(target))
#> Warning: Removed 280 rows containing missing values or values outside the scale range
#> (`geom_line()`).
#> Warning: Removed 280 rows containing missing values or values outside the scale range
#> (`geom_point()`).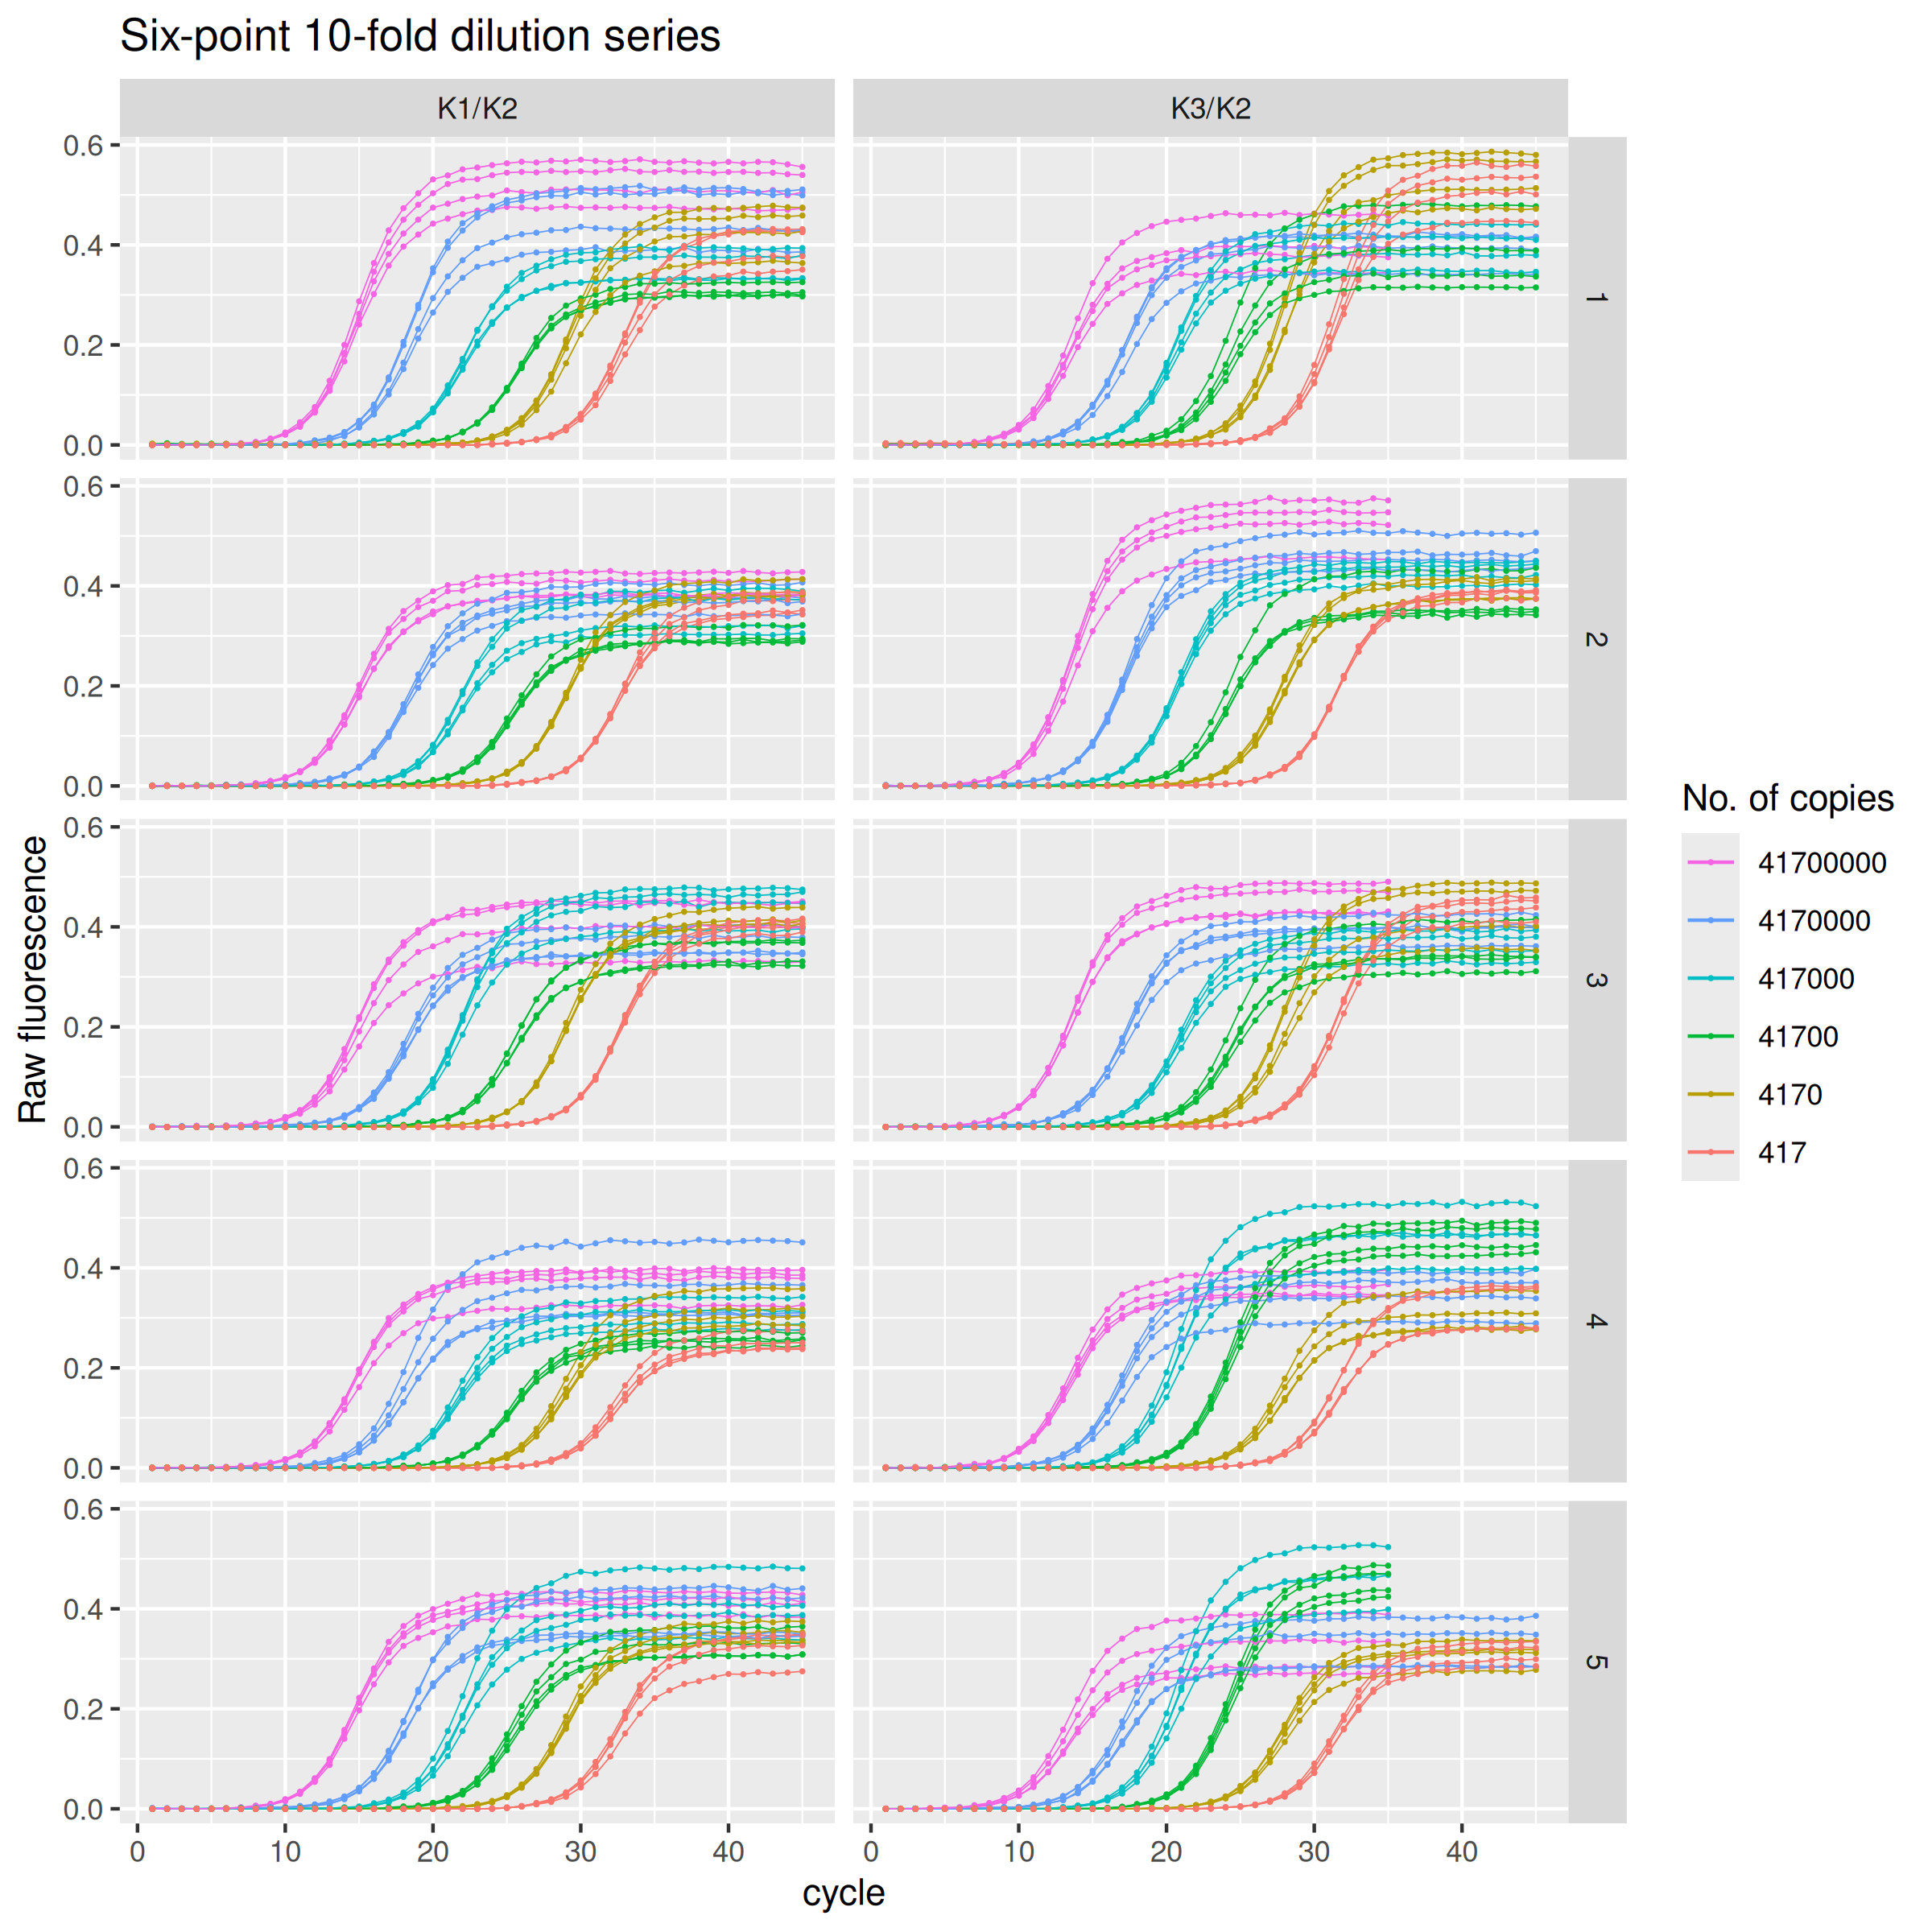
Please note that the rutledge project is released with a Contributor Code of Conduct. By contributing to this project, you agree to abide by its terms.
R. G. Rutledge. Sigmoidal curve-fitting redefines quantitative real-time PCR with the prospective of developing automated high-throughput applications. Nucleic Acids Research 32:e178 (2004). doi: 10.1093/nar/gnh177.