![]()
![]()


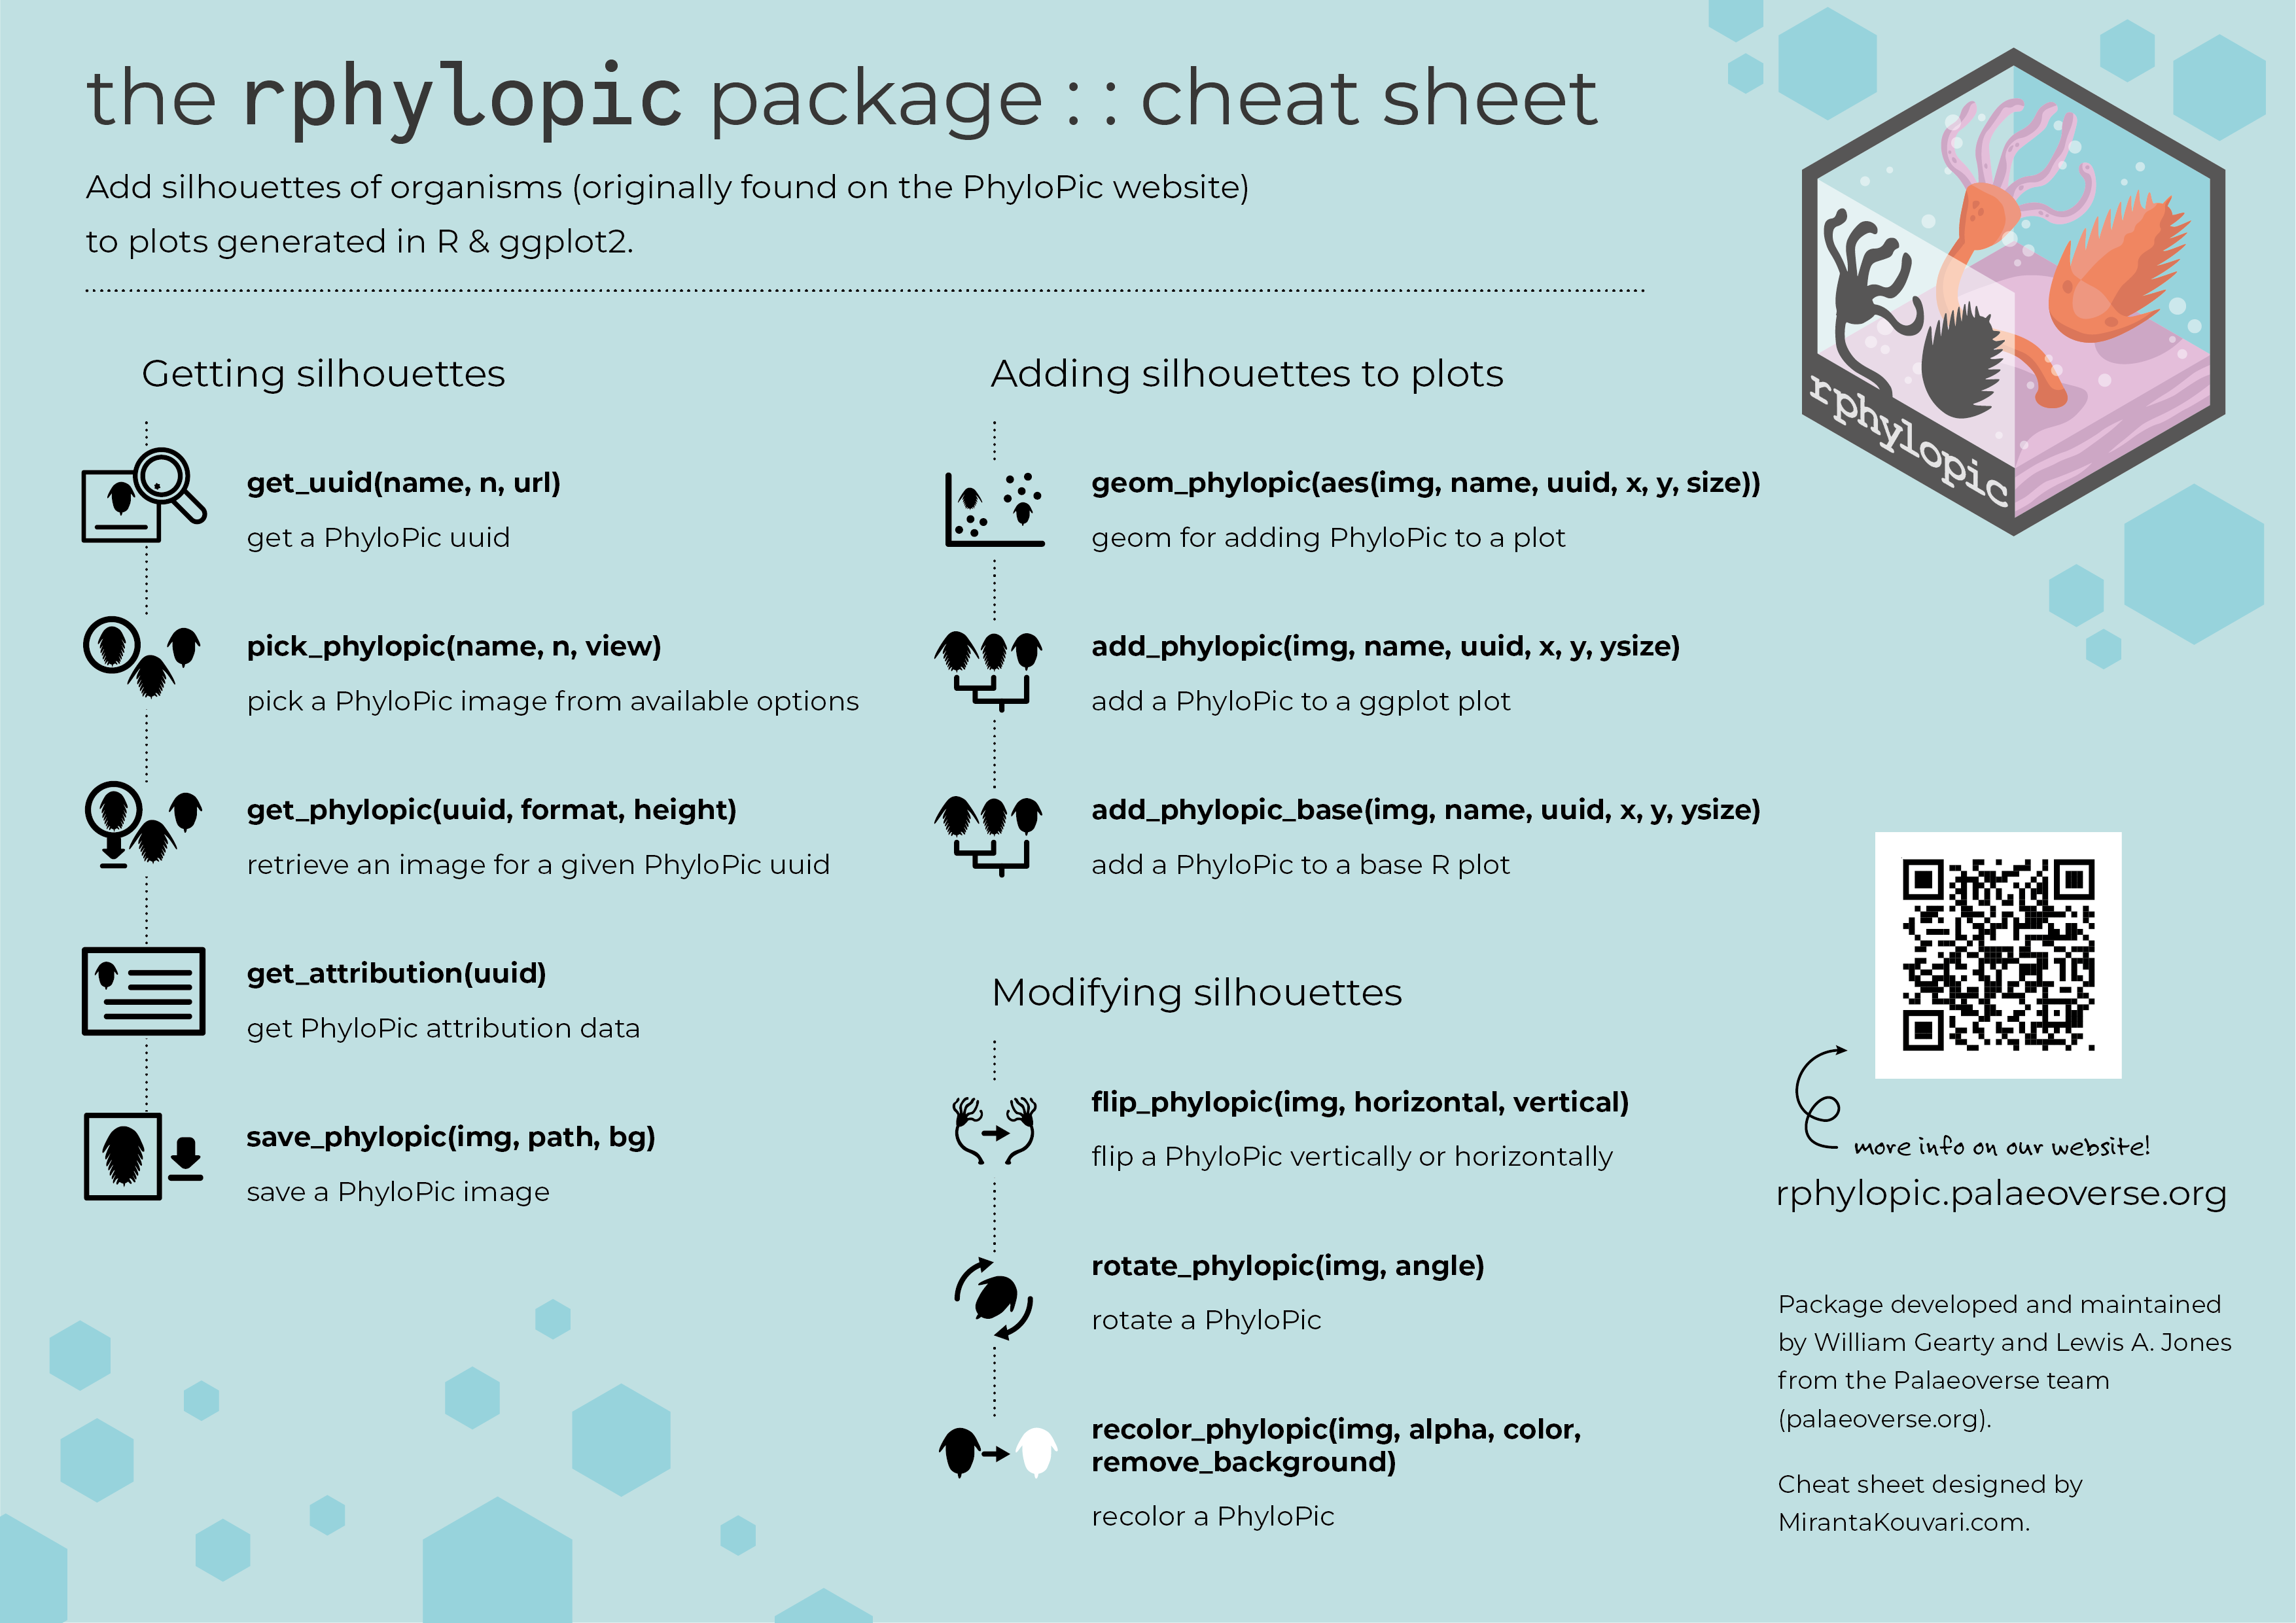
The purpose of the rphylopic package is to allow users
to add silhouettes of organisms to plots generated in base R and
ggplot2. To do so, it uses silhouettes made available via
the PhyloPic website.
rphylopic was originally developed and maintained by Scott Chamberlain. From ver.
1.0.0, the package is now developed and maintained by William Gearty and Lewis A. Jones from the Palaeoverse team.
The stable version of rphylopic can be installed from
CRAN using:
install.packages("rphylopic")The development version of rphylopic can be installed
via GitHub using:
install.packages("remotes")
remotes::install_github("palaeoverse/rphylopic")# Load rphylopic
library(rphylopic)
# Get a single image uuid for a species
uuid <- get_uuid(name = "Canis lupus", n = 1)
# Get the image for that uuid
img <- get_phylopic(uuid = uuid)
# But multiple silhouettes can exist per species...
uuid <- get_uuid(name = "Canis lupus", n = 5)# How do I pick?!
# It's difficult without seeing the image itself, let's use:
img <- pick_phylopic(name = "Canis lupus", n = 5)# OK, now we've got the image we want... let's add it to a plot!
plot(x = 1, y = 1, type = "n")
add_phylopic_base(img = img, x = 1.25, y = 1.25, height = 0.25)
# But can't we just add an image straight away using the uuid? Sure!
uuid <- get_uuid(name = "Canis lupus", n = 1)
add_phylopic_base(uuid = uuid, x = 1, y = 1, height = 0.25)
# What about just using the first image linked to the name? Definitely!
add_phylopic_base(name = "Canis lupus", x = 0.75, y = 0.75, height = 0.25)
# Black is a bit boring? OK...
add_phylopic_base(name = "Canis lupus", x = 0.75, y = 1.25, height = 0.25, color = "orange")# All of this functionality is available for ggplot2 as well...
# But we use add_phylopic and geom_phylopic instead!
library(ggplot2)
# Get image
uuid <- get_uuid(name = "Iris", n = 1)
img <- get_phylopic(uuid = uuid)
# Put a silhouette behind a plot
ggplot(iris) +
add_phylopic(x = 6.1, y = 3.2, img = img, alpha = 0.2) +
geom_point(aes(x = Sepal.Length, y = Sepal.Width))
# Plot silhouettes as points!
ggplot(iris) +
geom_phylopic(aes(x = Sepal.Length, y = Sepal.Width), img = img,
color = "purple", height = 0.25)# PhyloPic has a lot of contributors and we should acknowledge
# their work. You can get data about images using get_attribution
# Get valid uuid
uuid <- get_uuid(name = "Nycticebus")
# Get attribution data for uuid
get_attribution(uuid = uuid)# How do I save an image?
# Get image
img <- pick_phylopic(name = "Phascolarctos cinereus", n = 1)
# Save image
save_phylopic(img = img)If you are interested in contributing to the rphylopic R
package, you can do so by following these guidelines.
As with any community project, society, or meeting we feel it is important to established some expectations of behaviour. Please read our code of conduct, and reach out if you ever face any issues. Everyone has the right to live and work in a harassment-free environment.
If you use the rphylopic package in your work, please
acknowledge the contributors responsible for the image, acknowledge the
creator of PhyloPic (Michael Keesey),
and cite the following for rphylopic:
Gearty, W. and Jones, L.A. 2023. rphylopic: An R package for fetching, transforming, and visualising PhyloPic silhouettes. Methods in Ecology and Evolution, 14(11), 2700-2708. doi: 10.1111/2041-210X.14221.
![]()