
![]()
![]()
![]()
pcutils is a package that contains some useful functions
for me, it offers a range of utilities and functions for everyday
programming tasks.
The HTML documentation of the latest version is available at Github page.
The stable version is available on CRAN:
install.packages("pcutils")Or you can install the development version of pcutils
from GitHub with:
# install.packages("devtools")
devtools::install_github("Asa12138/pcutils")lib_ps, del_ps can library or detach
packages gracefully
dabiao print a message
dabiao("Message",char = "😀",n = 20):
😀😀😀😀😀😀Message😀😀😀😀😀😀
copy_vector help to copy a vector, like
datapasta package; copy_df help to copy a
dataframe
change_fac_lev can change a factor levels;
tidai can replace a vector by named vector
update_param update a parameter in a
function
sanxian print a three-line table
grepl.data.frame and gsub.data.frame do
grepl and gsub on a dataframe.
read.file read some special format files
trans_format convert file format like jpg, png, svg,
pdf, html…
read_fasta and write_fasta read and
write fasta file
download2 download a file from a url
download_ncbi_genome_file download a file from
NCBI
search_browse search and browse a website
translator translate a text
remove.outliers remove the outliers
count2 imitate the uniq -c in
shell
hebing group your dataframe; guolv
filter a dataframe; rm_low remove low frequency
trans transfer your data
mmscale do a scale specifying the min and
max
strsplit2 is better than strsplit for
me; t2 is better than t for me
explode expand a column in dataframe;
squash squash a dataframe
pre_number_str prepare a number string
twotest do a two-group test and
multitest do a multi-group test; group_test
performs multiple mean comparisons for a data.frame
fittest test a vector fit which
distribution
toXY transfer geographical latitude and longitude to
XY(m)
lm_coefficients get the coefficients of a linear
model; multireg fit a multiple linear model
rgb2code convert between r,g,b and color code;
is.ggplot.color judge a right color; add_alpha
add a alpha for a color
plotpdf, plotgif print pdf or gif for a
plot list
get_cols generate n colors based on a palette;
scale_fill_pc and scale_color_pc are scales
for ggplot
add_theme generate a mytheme object for
ggplot
legend_size resize the legend for a ggplot;
ggplot_lim get the x-y limits for a ggplot
generate_labels generate points position for a
series of labels
ggplot_translator translate the text of a
ggplot

stackplot plot a bar plot or stack bar plot easily;
areaplot plot a area plot easily
my_sankey plot a sankey plot
cor_plot plot a correlation plot
group_box plot a boxplot easily
gghuan plot a doughnut chart; gghuan2
plot a multi-doughnut chart
my_lm fit a linear model and plot
china_map plot a china map; sample_map
plot a sample map
gghist plot a histogram
venn plot a venn plot
tax_pie plot a pie plot
tax_radar plot a radar plot
my_circo plot a circlize plot
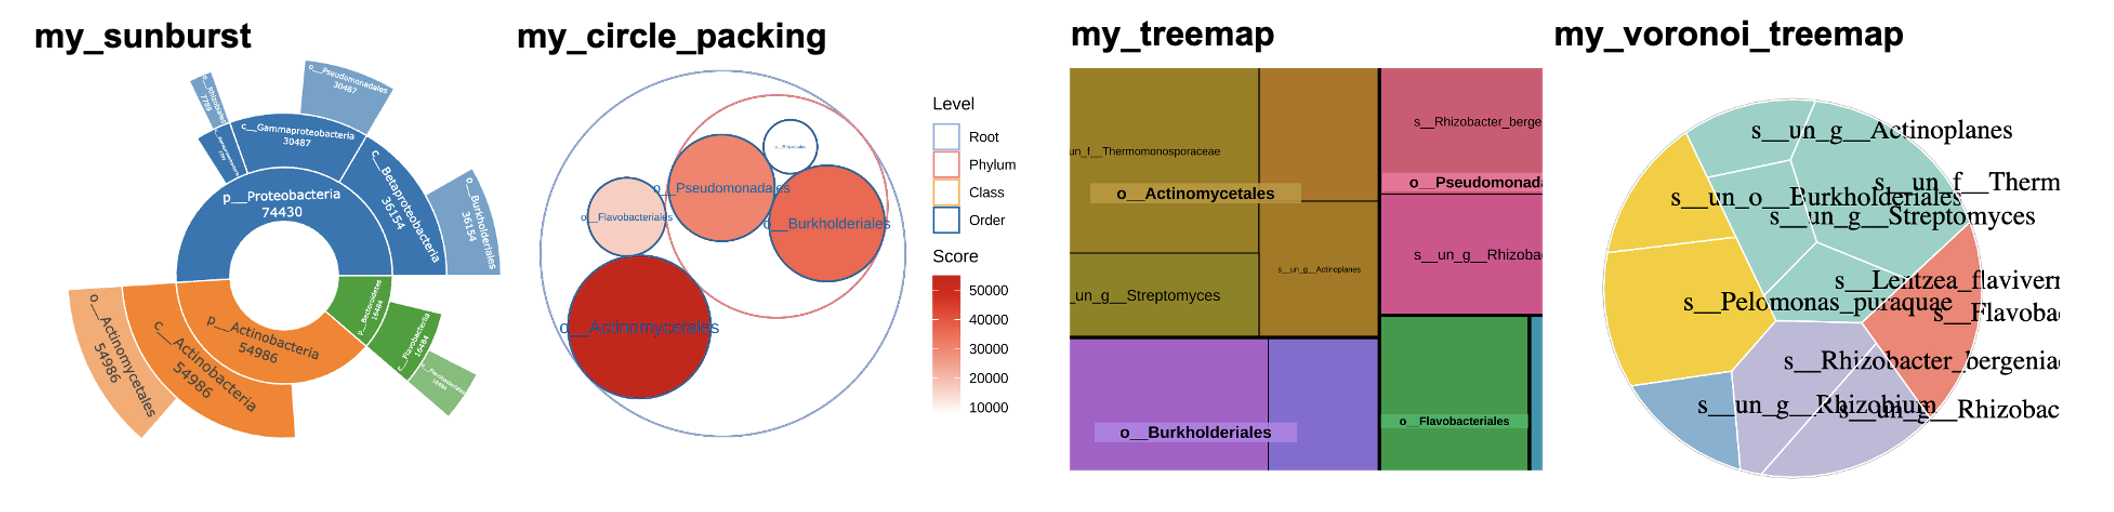
my_sunburst plot a sunburst plot
my_circle_packing plot a circle packing
plot
my_treemap plot a treemap plot
my_voronoi_treemap plot a voronoi treemap
plot
make_project build a R project
add_analysis create a specific Rmd file
make_gitbook build a git book
prepare_package prepare a package
update_NEWS_md update the NEWS.md
Easter Egg: my_cat will show my little
cat named GuoDong.