 papaja:
Prepare APA Journal Articles
papaja:
Prepare APA Journal Articleswith R Markdown ================
papaja:
Prepare APA Journal Articles
with R Markdown ================


![]()
![]()

Sections Example | Installation | Usage | Getting help | Citation | papaja in the wild | Computational reproducibility | Contribute | Related R packages | Package dependencies
papaja is an award-winning R package that facilitates creating computationally reproducible, submission-ready manuscripts which conform to the American Psychological Association (APA) manuscript guidelines (6th Edition). papaja provides
For a comprehensive introduction to papaja, see the current draft of the manual. If you have a specific question that is not answered in the manual, feel free to ask a question on Stack Overflow using the papaja tag. If you believe you have found a bug or would like to request a new feature, open an issue on Github and provide a minimal complete verifiable example.
Take a look at the source file of the package vignette and the resulting PDF. The vignette also contains some basic instructions.
To use papaja you need either a recent version of RStudio or pandoc. If you want to create PDF- in addition to DOCX-documents you additionally need a TeX distribution. We recommend you use TinyTex, which can be installed from within R:
if(!requireNamespace("tinytex", quietly = TRUE)) install.packages("tinytex")

tinytex::install_tinytex()
You may also consider MikTeX for Windows, MacTeX for Mac, or TeX Live for Linux. Please refer to the papaja manual for detailed installation instructions.
papaja is available on CRAN but you can also install it from the GitHub repository:
# Install latest CRAN release
install.packages("papaja")

# Install remotes package if necessary
if(!requireNamespace("remotes", quietly = TRUE)) install.packages("remotes")

# Install the stable development version from GitHub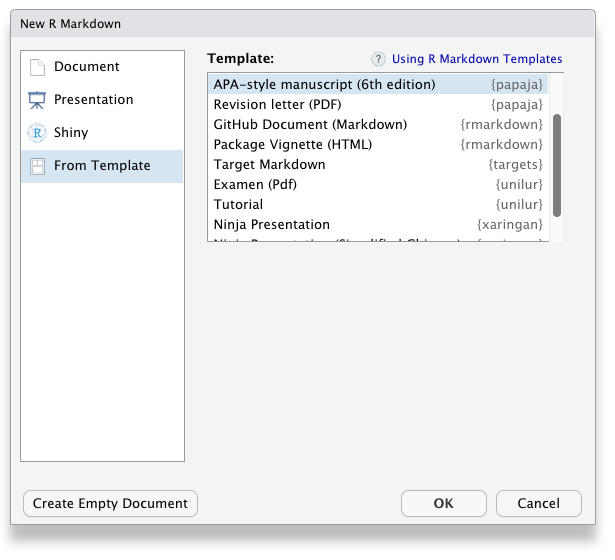
remotes::install_github("crsh/papaja")Once papaja is installed, you can select the APA template when creating a new R Markdown file through the RStudio menus.
To add citations, specify your bibliography-file in the YAML front
matter of the document (bibliography: my.bib) and start
citing (for details, see pandoc manual on the citeproc
extension. You may also be interested in citr, an R
Studio addin to swiftly insert Markdown citations and R Studio’s
visual editor, which also enables swiftly inserting
citations.
The functions apa_print() and apa_table()
facilitate reporting results of your analyses. When you pass the an
output object of a supported class, such as an htest- or
lm-object, to apa_print(), it will return a
list of character strings that you can use to report the results of your
analysis.
my_lm <- lm(
  Sepal.Width ~ Sepal.Length + Petal.Width + Petal.Length
  , data = iris
)
apa_lm <- apa_print(my_lm)

apa_lm$full_result$Sepal_Length
## [1] "$b = 0.61$, 95\\% CI $[0.48, 0.73]$, $t(146) = 9.77$, $p < .001$"papaja currently provides methods for the following object classes:
| A-B | D-L | L-S | S-Z |
|---|---|---|---|
| afex_aov | default | lsmobj | summary.aovlist |
| anova | emmGrid | manova | summary.glht |
| anova.lme | glht | merMod | summary.glm |
| Anova.mlm | glm | mixed | summary.lm |
| aov | htest | papaja_wsci | summary.manova |
| aovlist | list | summary_emm | summary.ref.grid |
| BFBayesFactor | lm | summary.Anova.mlm | |
| BFBayesFactorTop | lme | summary.aov |
apa_table() may be used to produce publication-ready
tables in an R Markdown document. For instance, you might want to report
some condition means (with standard errors).
npk |>
  # Summarize data
  dplyr::group_by(N, P) |>
  dplyr::summarise(
    mean = mean(yield)
    , se = sd(yield) / sqrt(length(yield))
    , .groups = "drop"
  ) |>
  # Label columns
  label_variables(
    N = "Nitrogen"
    , P = "Phosphate"
    , mean = "*M*"
    , se = "*SE*"
  ) |>
  # Print table
  apa_table(caption = "Mean pea yield (with standard errors)")
Table 1. Mean pea yield (with standard errors)
| Nitrogen | Phosphate | M | SE |
|---|---|---|---|
| 0 | 0 | 51.72 | 1.88 |
| 0 | 1 | 52.42 | 2.65 |
| 1 | 0 | 59.22 | 2.66 |
| 1 | 1 | 56.15 | 2.08 |
This is a fairly simple example, but apa_table() may be
used to generate more complex
tables.
apa_table(), of course, plays nicely with the output
from apa_print(). Thus, it is possible to conveniently
report complete regression tables, ANOVA tables, or the output from
mixed-effects models.
lm(Sepal.Width ~ Sepal.Length + Petal.Width + Petal.Length, data = iris) |>
  apa_print() |>
  apa_table(caption = "Iris regression table.")
Table 2. Iris regression table.
| Predictor | b | 95% CI | t | df | p |
|---|---|---|---|---|---|
| Intercept | 1.04 | [0.51, 1.58] | 3.85 | 146 | < .001 |
| Sepal Length | 0.61 | [0.48, 0.73] | 9.77 | 146 | < .001 |
| Petal Width | 0.56 | [0.32, 0.80] | 4.55 | 146 | < .001 |
| Petal Length | -0.59 | [-0.71, -0.46] | -9.43 | 146 | < .001 |
papaja further provides functions to create
publication-ready plots. For example, you can use
apa_barplot(), apa_lineplot(), and
apa_beeplot() (or the general function
apa_factorial_plot()) to visualize the results of factorial
study designs:
apa_beeplot(
  data = stroop_data
  , dv = "response_time"
  , id = "id"
  , factors = c("congruency", "load")
  , ylim = c(0, 800)
  , dispersion = wsci # within-subjects confidence intervals
  , conf.level = .99
  , las = 1
)
If you prefer ggplot2, try theme_apa().
library("ggplot2")
library("ggforce")

p <- ggplot(
  stroop_data
  , aes(x = congruency, y = response_time, shape = load, fill = load)
) +
  geom_violin(alpha = 0.2, color = grey(0.6)) +
  geom_sina(color = grey(0.6)) +
  stat_summary(position = position_dodge2(0.95), fun.data = mean_cl_normal) +
  lims(y = c(0, max(stroop_data$response_time))) +
  scale_shape_manual(values = c(21, 22)) +
  scale_fill_grey(start = 0.6, end = 1) +
  labs(
    x = "Congruency"
    , y = "Response time"
    , shape = "Cognitive load"
    , fill = "Cognitive load"
  )

p + theme_apa()
## Warning: Computation failed in `stat_summary()`.
## Caused by error in `fun.data()`:
## ! The package "Hmisc" is required.
Don’t use RStudio? No problem. Use the rmarkdown::render
function to create articles:
# Create new R Markdown file
rmarkdown::draft(
  "mymanuscript.Rmd"
  , "apa6"
  , package = "papaja"
  , create_dir = FALSE
  , edit = FALSE
)

# Render manuscript
rmarkdown::render("mymanuscript.Rmd")For a comprehensive introduction to papaja, check out the current draft of the papaja manual. If you have a specific question that is not answered in the manual, feel free to ask a question on Stack Overflow using the papaja tag. If you believe you have found a bug or you want to request a new feature, open an issue on Github and provide a minimal complete verifiable example.
Please cite papaja if you use it.
Aust, F. & Barth, M. (2024). papaja: Prepare reproducible APA journal articles with R Markdown. R package version 0.1.3. Retrieved from https://github.com/crsh/papajaFor convenience, you can use
cite_r() or copy the reference information returned by
citation('papaja') to your BibTeX file:
@Manual{,
  title = {{papaja}: {Prepare} reproducible {APA} journal articles with {R Markdown}},
  author = {Frederik Aust and Marius Barth},
  year = {2024},
  note = {R package version 0.1.3},
  url = {https://github.com/crsh/papaja},
  doi = {10.32614/CRAN.package.papaja},
}If you are interested in seeing how others are using papaja, you can find a collection of papers and the corresponding R Markdown files in the manual.
If you have published a paper that was written with papaja, please add the reference to the public Zotero group yourself or send us to me.
To ensure mid- to long-term computational reproducibility we highly recommend conserving the software environment used to write a manuscript (e.g. R and all R packages) either in a software container or a virtual machine. This way you can be sure that your R code does not break because of updates to R or any R package. For a brief primer on containers and virtual machines see the supplementary material by Klein et al. (2018).
Docker is the most widely used containerization approach. It is open source and free to use but requires some disk space. CodeOcean is a commercial service that builds on Docker, facilitates setting up and sharing containers and lets you run computations in the cloud. See the papaja manual on how to get started using papaja with Docker or CodeOcean and our Docker workflow tailored for easy use with papaja.

Like papaja and want to contribute? We highly
appreciate any contributions to the R package or its documentation. Take
a look at the open
issues if you need inspiration. There are many additional analyses
that we would like apa_print() to support. Any new
S3/S4-methods for this function are always appreciated (e.g.,
factanal, fa, lavaan). For a
primer on adding new apa_print()-methods, see the
getting-started-vignette:
vignette("extending_apa_print", package = "papaja")Before working on a contribution, please review our brief contributing guidelines and code of conduct.
By now, there are a couple of R packages that provide convenience functions to facilitate the reporting of statistics in accordance with APA guidelines.
If you are looking for other journal article templates, you may be interested in the rticles package.


