![]()
mpwR [ɪmˈpaʊə(r)] offers a systematic approach for comparing proteomic workflows and empowers the researcher to effortlessly access valuable information about identifications, data completeness, quantitative precision, and other performance indicators across an unlimited number of analyses and multiple software tools. It can be used to analyze label-free mass spectrometry-based experiments with data-dependent or data-independent spectral acquisition.
The functions of mpwR provide a great foundation to generate customized reports e.g. with RMarkdown or to build shiny apps/dashboards for downstream data analysis. An example for a shiny dashboard is available here.
Install the development version from GitHub using the devtools
package by using the following commands:
# install.packages("devtools") #remove "#" if you do not have devtools package installed yet
devtools::install_github("OKdll/mpwR", dependencies = TRUE) # use dependencies TRUE to install all required packages for mpwRAs input the standard outputs of ProteomeDiscoverer, Spectronaut, DIA-NN or MaxQuant are supported by mpwR. Details about further requirements are listed in the vignette Requirements.
Importing the output files from each software can be easily performed
with prepare_mpwR. Further details about importing data are
highlighted in the vignette Import.
files <- prepare_mpwR(path = "Path_to_Folder_with_files")library(mpwR)
library(flowTraceR)
library(magrittr)
library(dplyr)
library(tidyr)
library(stringr)
library(tibble)
library(ggplot2)This is a basic example which shows the downstream analysis for number of identifications and data completeness. Please check the vignette Workflow for a detailed analysis pipeline and more functionalities.
#get example
files <- create_example()The number of identifications can be determined with
get_ID_Report.
ID_Reports <- get_ID_Report(input_list = files)
For each analysis an ID Report is generated and stored in a list. Each ID Report entry can be easily accessed:
ID_Reports[["DIA-NN"]]
#>   Analysis Run ProteinGroup.IDs Protein.IDs Peptide.IDs Precursor.IDs
#> 1   DIA-NN R01                5           5           5             5
#> 2   DIA-NN R02                5           5           5             5
Each ID Report can be plotted with plot_ID_barplot from
precursor- to proteingroup-level. The generated barplots are stored in a
list.
ID_Barplots <- plot_ID_barplot(input_list = ID_Reports, level = "ProteinGroup.IDs")
The individual barplots can be easily accessed:
ID_Barplots[["DIA-NN"]]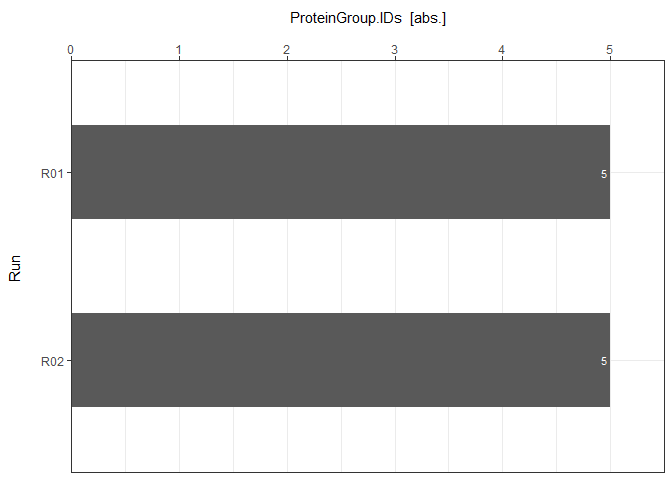
As a visual summary a boxplot can be generated with
plot_ID_boxplot.
plot_ID_boxplot(input_list = ID_Reports, level = "ProteinGroup.IDs")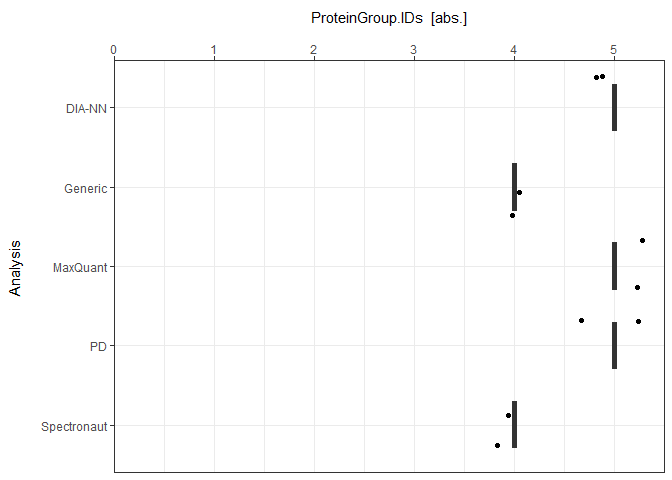
Data Completeness can be determined with get_DC_Report
for absolute numbers or in percentage.
DC_Reports <- get_DC_Report(input_list = files, metric = "absolute")
DC_Reports_perc <- get_DC_Report(input_list = files, metric = "percentage")
For each analysis a DC Report is generated and stored in a list. Each DC Report entry can be easily accessed:
DC_Reports[["DIA-NN"]]
#>   Analysis Nr.Missing.Values Precursor.IDs Peptide.IDs Protein.IDs
#> 1   DIA-NN                 1             0           0           4
#> 2   DIA-NN                 0             5           5           3
#>   ProteinGroup.IDs  Profile
#> 1                2   unique
#> 2                4 complete
Each DC Report can be plotted with plot_DC_barplot from
precursor- to proteingroup-level. The generated barplots are stored in a
list.
DC_Barplots <- plot_DC_barplot(input_list = DC_Reports, level = "ProteinGroup.IDs", label = "absolute")
The individual barplots can be easily accessed:
DC_Barplots[["DIA-NN"]]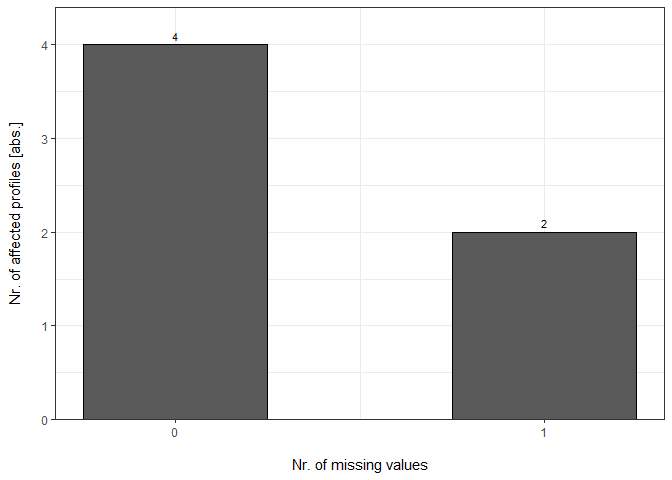
plot_DC_barplot(input_list = DC_Reports_perc, level = "ProteinGroup.IDs", label = "percentage")[["DIA-NN"]]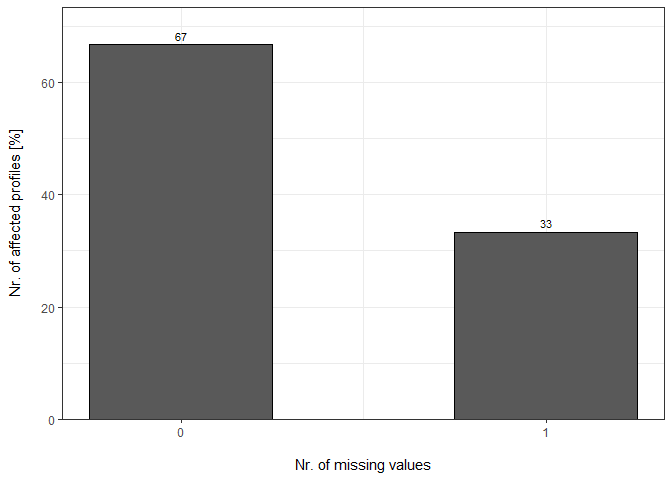
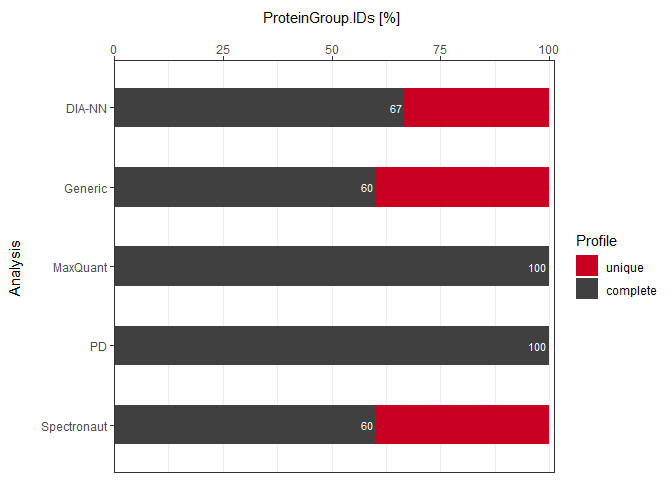
As a visual summary a stacked barplot can be generated with
plot_DC_stacked_barplot.
plot_DC_stacked_barplot(input_list = DC_Reports, level = "ProteinGroup.IDs", label = "absolute")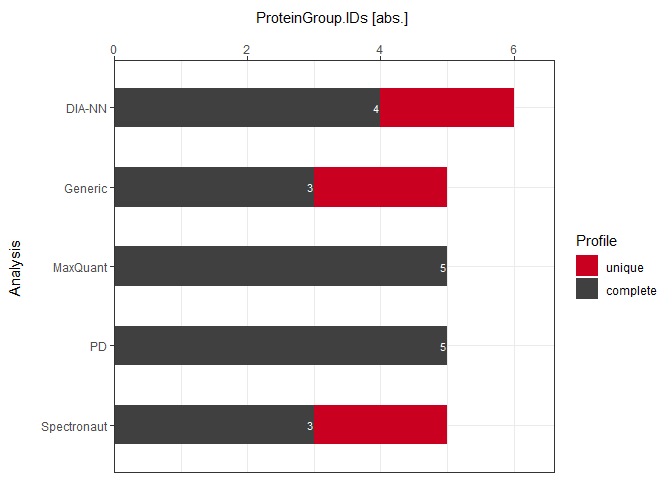
plot_DC_stacked_barplot(input_list = DC_Reports_perc, level = "ProteinGroup.IDs", label = "percentage")