![]()
![]()
lares is an R package designed to automate, improve, and accelerate everyday analytics and machine learning tasks. It offers a wide variety of functions grouped in families for:
Tip: See all available functions and documentation here or type
?lares::in RStudio to explore interactively.
# CRAN VERSION
install.packages("lares")

# DEV VERSION (latest updates)
# If you don't have remotes installed yet, run: install.packages('remotes')
remotes::install_github("laresbernardo/lares")
# For a full installation with recommended dependencies:
remotes::install_github("laresbernardo/lares", dependencies = TRUE)
Windows users: You may need to install RTools to build the dev version.
lares in
action!laresh2o_automl(), plot_model_results() –
Automated machine learning pipeline with optimal model selection and
visualizations.freqs(), distr(), corr_var(),
corr_cross() – Instantly summarize, visualize, and uncover
relationships in your data.ohse() – Efficient and smart one-hot encoding for
categorical variables.cache_* – Speed up workflows by caching expensive
computations.robyn_* – Additional functions to support Robyn inputs
and outputs.fb_* – Interact with Meta’s Marketing APIgpt_* – Structured prompts builder and interact with
OpenAI’s APIread_encrypted(), write_encrypted() –
Interact with encrypted files to keep secrets safe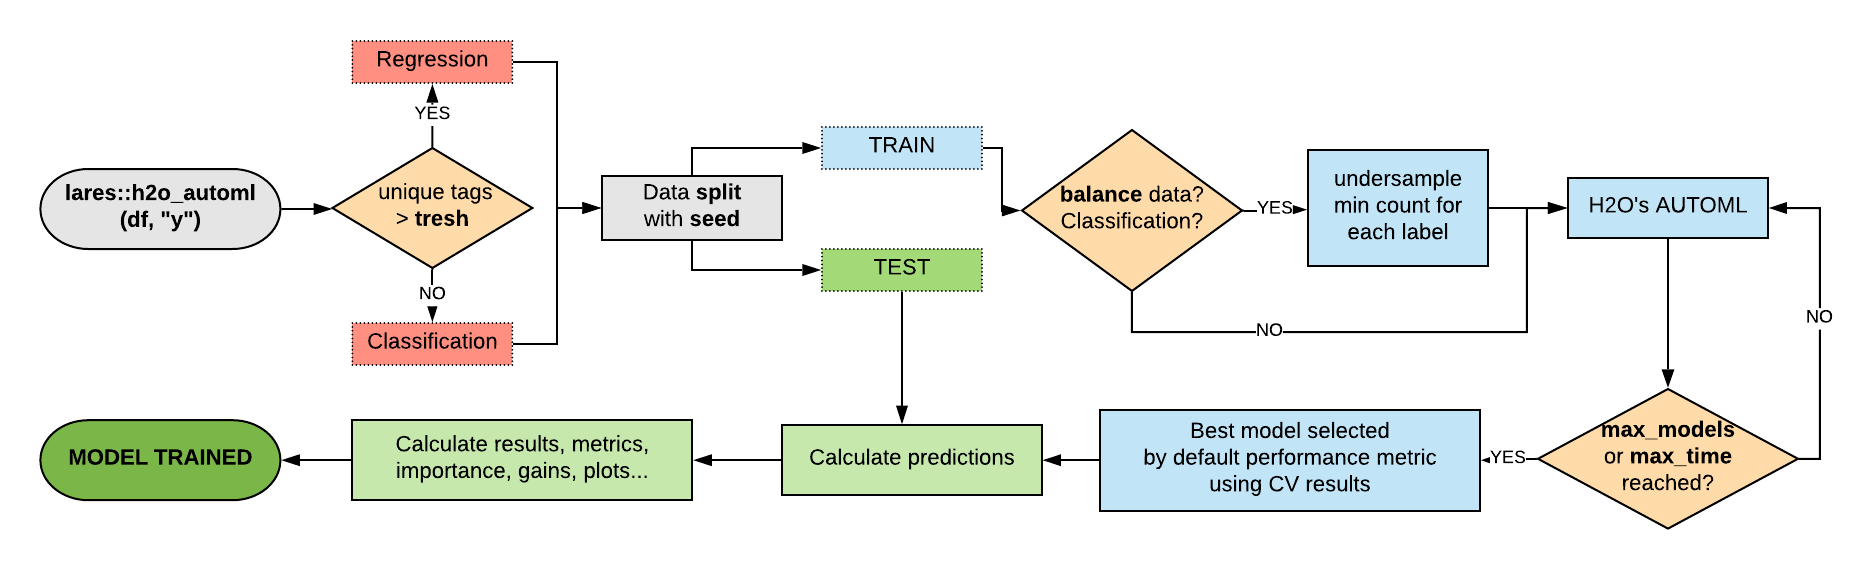
?lares::function_name in RStudio for detailed help
on any function.