The goal of gregRy is to make the GREGORY estimator
easily available to use.
The development version of gregRy is available from GitHub with:
# install.packages("devtools")
devtools::install_github("olekwojcik/gregRy")The package gregRy does not contain a dataset, which is
why our example utilizes the package pdxTrees
library(gregRy)
set.seed(13)
# load and wrangle data

# Overall dataset to create estimates with
# Includes response variable and predictors


family_filter_data <- get_pdxTrees_parks() %>%
  as.data.frame() %>%
  drop_na(DBH, Crown_Width_NS, Tree_Height) %>%
  filter(Condition != "Dead") %>%
  select(UserID, Tree_Height, Crown_Width_NS, DBH, Condition, Family) %>%
  group_by(Family) %>%
  summarize(count = n())

dat <- get_pdxTrees_parks() %>%
  as.data.frame() %>%
  drop_na(DBH, Crown_Width_NS, Tree_Height) %>%
  filter(Condition != "Dead") %>%
  select(UserID, Tree_Height, Crown_Width_NS, DBH, Condition, Family) %>%
  left_join(family_filter_data, by = "Family") %>%
  filter(count > 4) %>%
  select(UserID, Tree_Height, Crown_Width_NS, DBH, Condition, Family)

dat_s <- get_pdxTrees_parks() %>%
  as.data.frame() %>%
  drop_na(DBH, Crown_Width_NS, Tree_Height) %>%
  filter(Condition != "Dead") %>%
  select(UserID, Tree_Height, Crown_Width_NS, DBH, Condition, Family) %>%
  left_join(family_filter_data, by = "Family") %>%
  filter(count > 4) %>%
  select(UserID, Tree_Height, Crown_Width_NS, DBH, Condition, Family) %>%
  group_by(Family) %>%
  slice_sample(prop = 0.25) %>%
  ungroup()

dat_est <- dat %>%
  filter(Family == "Pinaceae")
predictors <- c("Crown_Width_NS", "DBH")

dat_x_bar <- dat %>%
  group_by(Family) %>%
  summarize(across(predictors,
                   mean)) %>%
  pivot_longer(!Family,
               names_to = "variable",
               values_to = "mean")

dat_count_est <- dat %>%
  group_by(Family) %>%
  summarize(count = n())

# Create dataset of proportions using estimation and resolution

dat_prop <- left_join(dat, dat_count_est, by = "Family") %>%
  group_by(Condition, Family) %>%
  summarize(prop = n()/count) %>%
  distinct() %>%
  ungroup()

# Create dataset of means of 'pixel' data

dat_x_means <- get_pdxTrees_parks() %>%
  as.data.frame() %>%
  drop_na(DBH, Crown_Width_NS, Tree_Height) %>%
  dplyr::summarize(DBH = mean(DBH), Crown_Width_NS = mean(Crown_Width_NS),
            Tree_Height = mean(Tree_Height))

dat_x_bar_new <- dat_x_bar %>%
  filter(variable == "Crown_Width_NS") %>%
  mutate(Crown_Width_NS = mean) %>%
  select(Family, Crown_Width_NS)
To use GREGORY, we need 3 different datasets.
The first dataset is the overall data:
#>   UserID Tree_Height Crown_Width_NS  DBH Condition   Family
#> 1      1         105             44 37.4      Fair Pinaceae
#> 2      2          94             49 32.5      Fair Pinaceae
#> 3      3          23             28  9.7      Fair Rosaceae
#> 4      4          28             38 10.3      Poor Fagaceae
#> 5      5         102             43 33.2      Fair Pinaceae
#> 6      6          95             35 32.1      Fair Pinaceae
The second dataset is the means of the predictors at the estimation level (Family estimates):
#>          Family Crown_Width_NS
#> 1  Altingiaceae       40.60444
#> 2 Anacardiaceae       19.25000
#> 3 Aquifoliaceae       14.85417
#> 4    Betulaceae       31.08437
#> 5  Bignoniaceae       31.54167
#> 6   Cannabaceae       35.12500
The third dataset is contains both the resolution and estimation, with the proportion of resolution in the given estimation unit:
#> Condition Family prop
#> 1 Fair Altingiaceae 0.9066667
#> 2 Fair Anacardiaceae 0.7500000
#> 3 Fair Aquifoliaceae 0.8750000
#> 4 Fair Betulaceae 0.8298755
#> 5 Fair Bignoniaceae 0.7916667
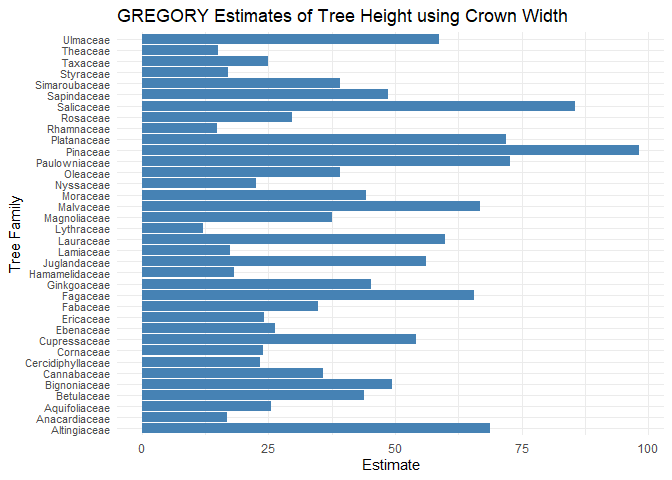
#> 6 Fair Cannabaceae 0.8125000# Create GREGORY estimates
x1 <- gregory_all(plot_df = dat_s %>% drop_na(),
resolution = "Condition",
estimation = "Family",
pixel_estimation_means = dat_x_bar_new,
proportions = dat_prop,
formula = Tree_Height ~ Crown_Width_NS,
prop = "prop")
print(x1)
#> # A tibble: 36 x 3
#> Family estimate variance
#> <chr> <dbl> <dbl>
#> 1 Altingiaceae 68.8 604.
#> 2 Anacardiaceae 16.8 41.3
#> 3 Aquifoliaceae 25.6 73.1
#> 4 Betulaceae 43.9 393.
#> 5 Bignoniaceae 49.4 1277.
#> 6 Cannabaceae 35.9 193.
#> 7 Cercidiphyllaceae 23.3 48.6
#> 8 Cornaceae 23.9 207.
#> 9 Cupressaceae 54.1 1118.
#> 10 Ebenaceae 26.3 NA
#> # ... with 26 more rows
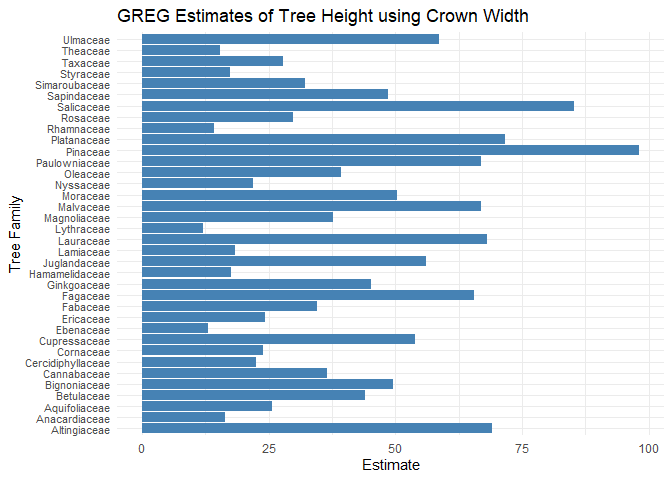
# Create GREG estimates
x2 <- greg_all(plot_df = dat_s %>% drop_na(),
         estimation = "Family",
         pixel_estimation_means = dat_x_bar_new,
         formula = Tree_Height ~ Crown_Width_NS)
print(x2)
#> # A tibble: 36 x 3
#>    Family            estimate variance
#>    <chr>                <dbl>    <dbl>
#>  1 Altingiaceae          69.0    604.
#>  2 Anacardiaceae         16.5     41.3
#>  3 Aquifoliaceae         25.6     73.1
#>  4 Betulaceae            44.0    393.
#>  5 Bignoniaceae          49.6   1277.
#>  6 Cannabaceae           36.6    193.
#>  7 Cercidiphyllaceae     22.6     48.6
#>  8 Cornaceae             23.9    207.
#>  9 Cupressaceae          53.9   1118.
#> 10 Ebenaceae             13       NA
#> # ... with 26 more rows