
![]()


![]()
ggrain - Raincloud
Plotsggrain is an R-package that allows you to create
Raincloud plots - following the ‘Grammar of Graphics’ (i.e., ggplot2) -
that are:
ggrain
was developed by Nicholas Judd, Jordy van Langen,
Micah Allen, and Rogier Kievit.
- Judd, N., van Langen, J., Allen, M., & Kievit, R.A.
    ggrain: A Rainclouds Geom for 'ggplot2'.
    R package version 0.0.4.
    CRAN 2023, https://doi.org/10.32614/CRAN.package.ggrain,
    https://CRAN.R-project.org/package=ggrain
ggplot(iris, aes(x = 1, y = Sepal.Length)) +
geom_rain()There are two ways to install this package.
install.packages("ggrain")

library(ggrain)if (!require(remotes)) {
install.packages("remotes")
}
remotes::install_github('njudd/ggrain')
library(ggrain)Raincloud per group
ggplot(iris, aes(x = Species, y = Sepal.Length, fill =  Species)) +
    geom_rain(rain.side = 'l')
Different groups overlapped
ggplot(iris, aes(x = 1, y = Sepal.Length, fill = Species)) +
    geom_rain(alpha = .5)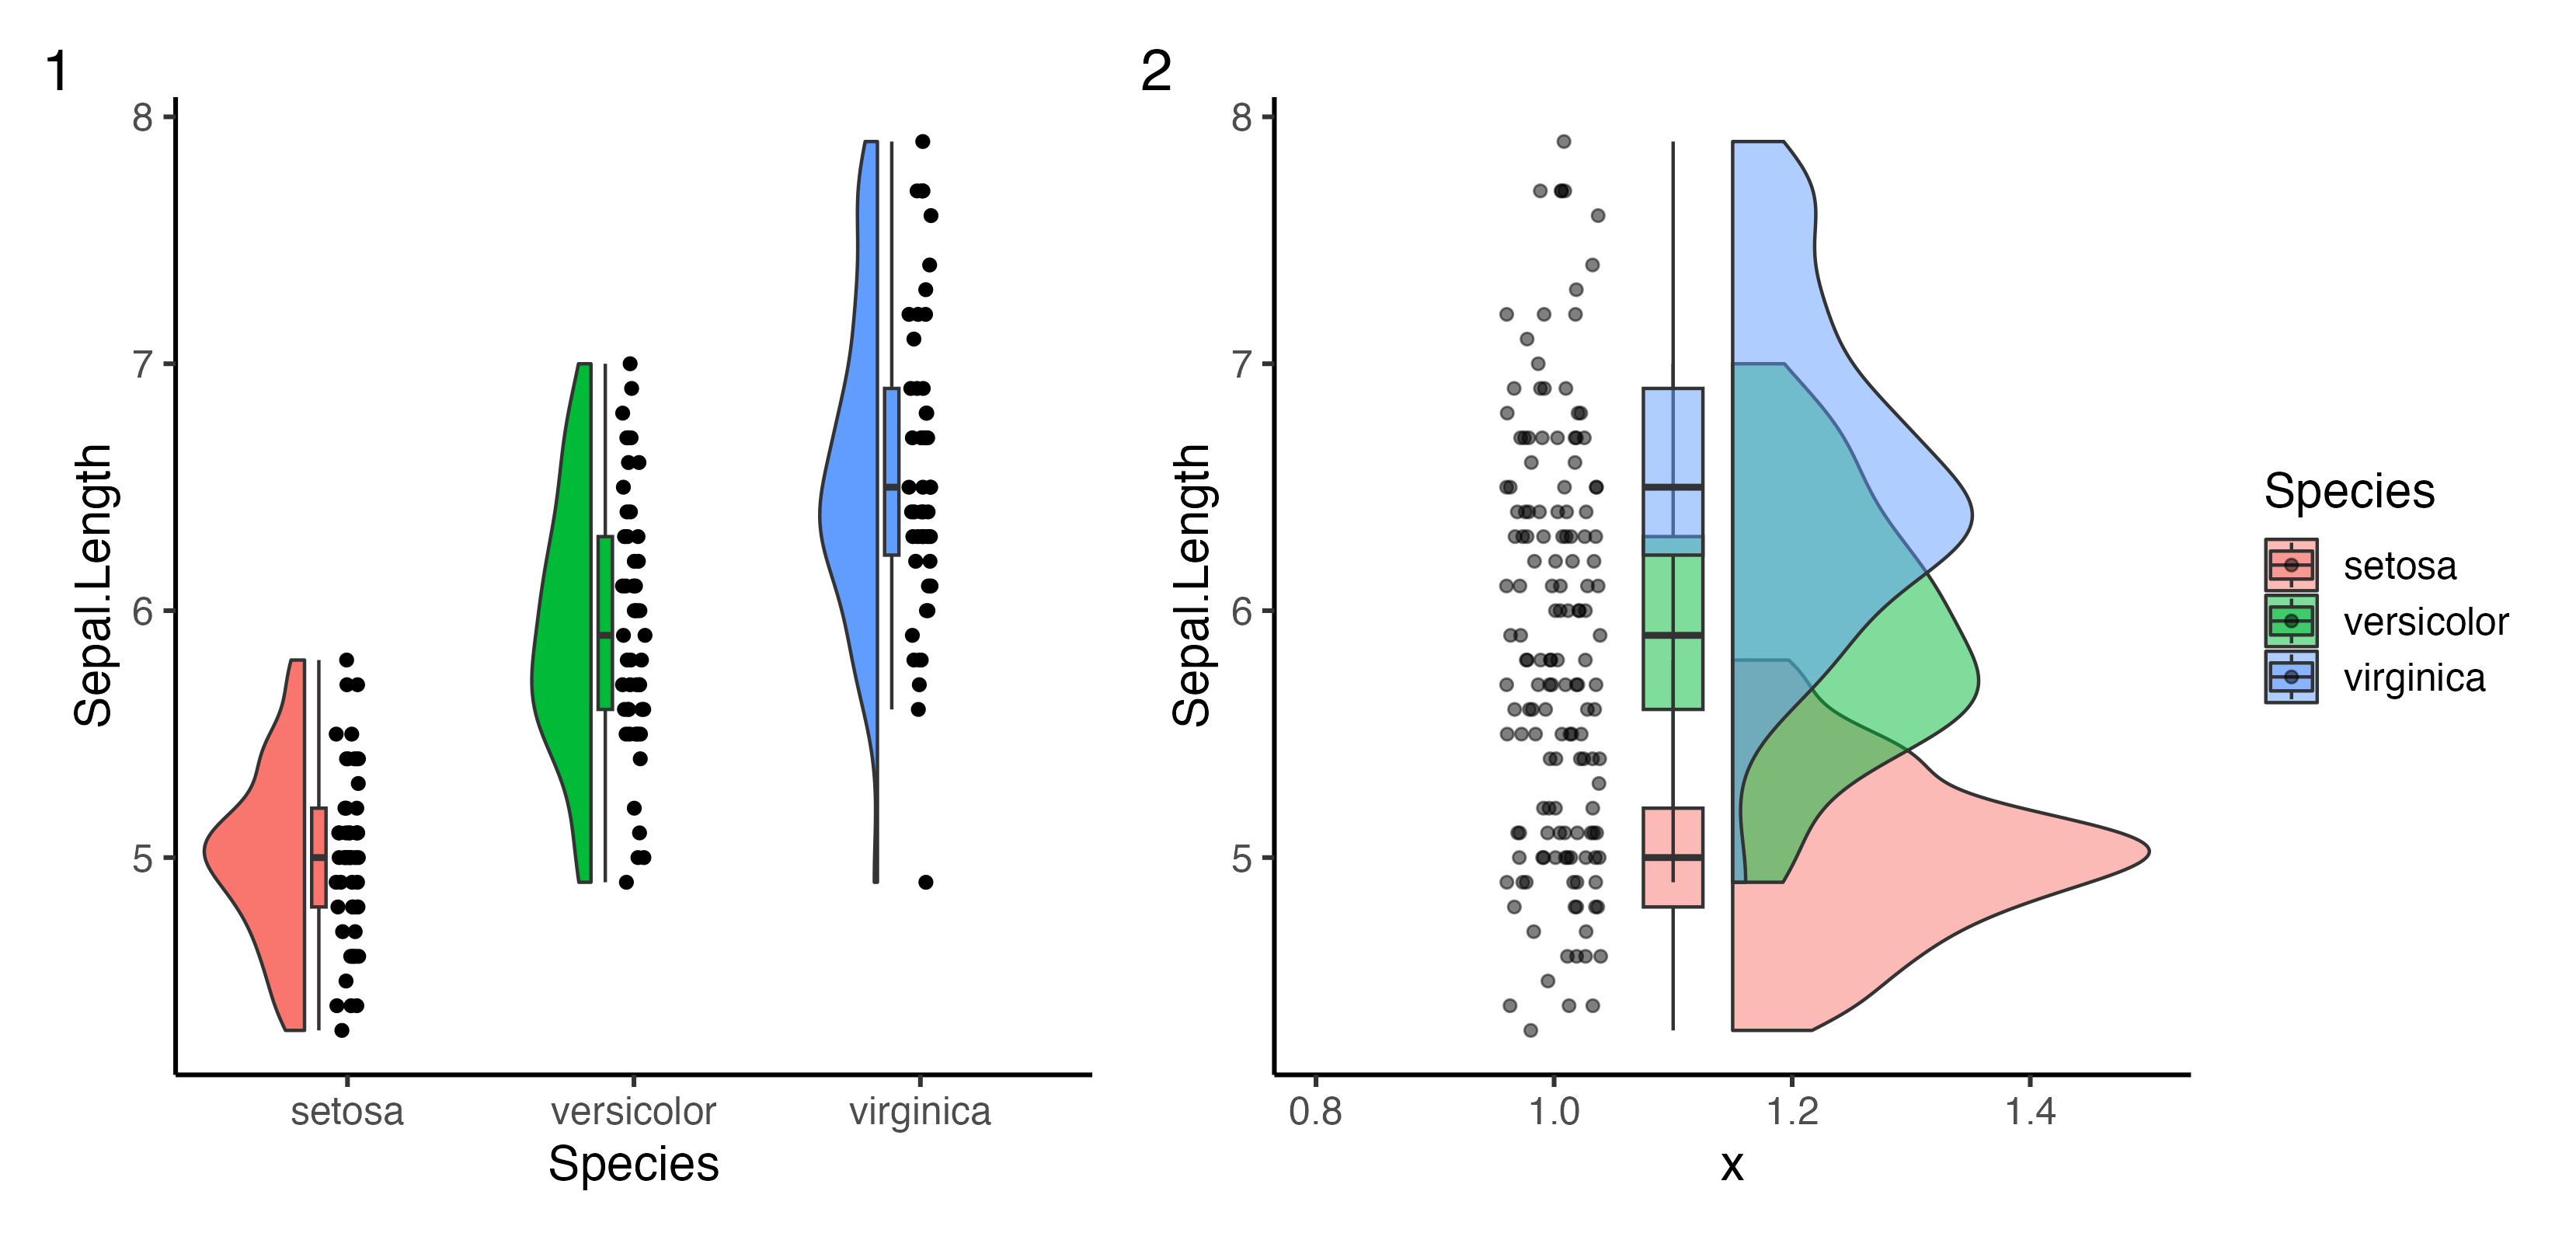
For a complete overview of ggrain such as a 2-by-2
raincloud plot or multiple repeated measures, please see our Vignette.
ggrain specific
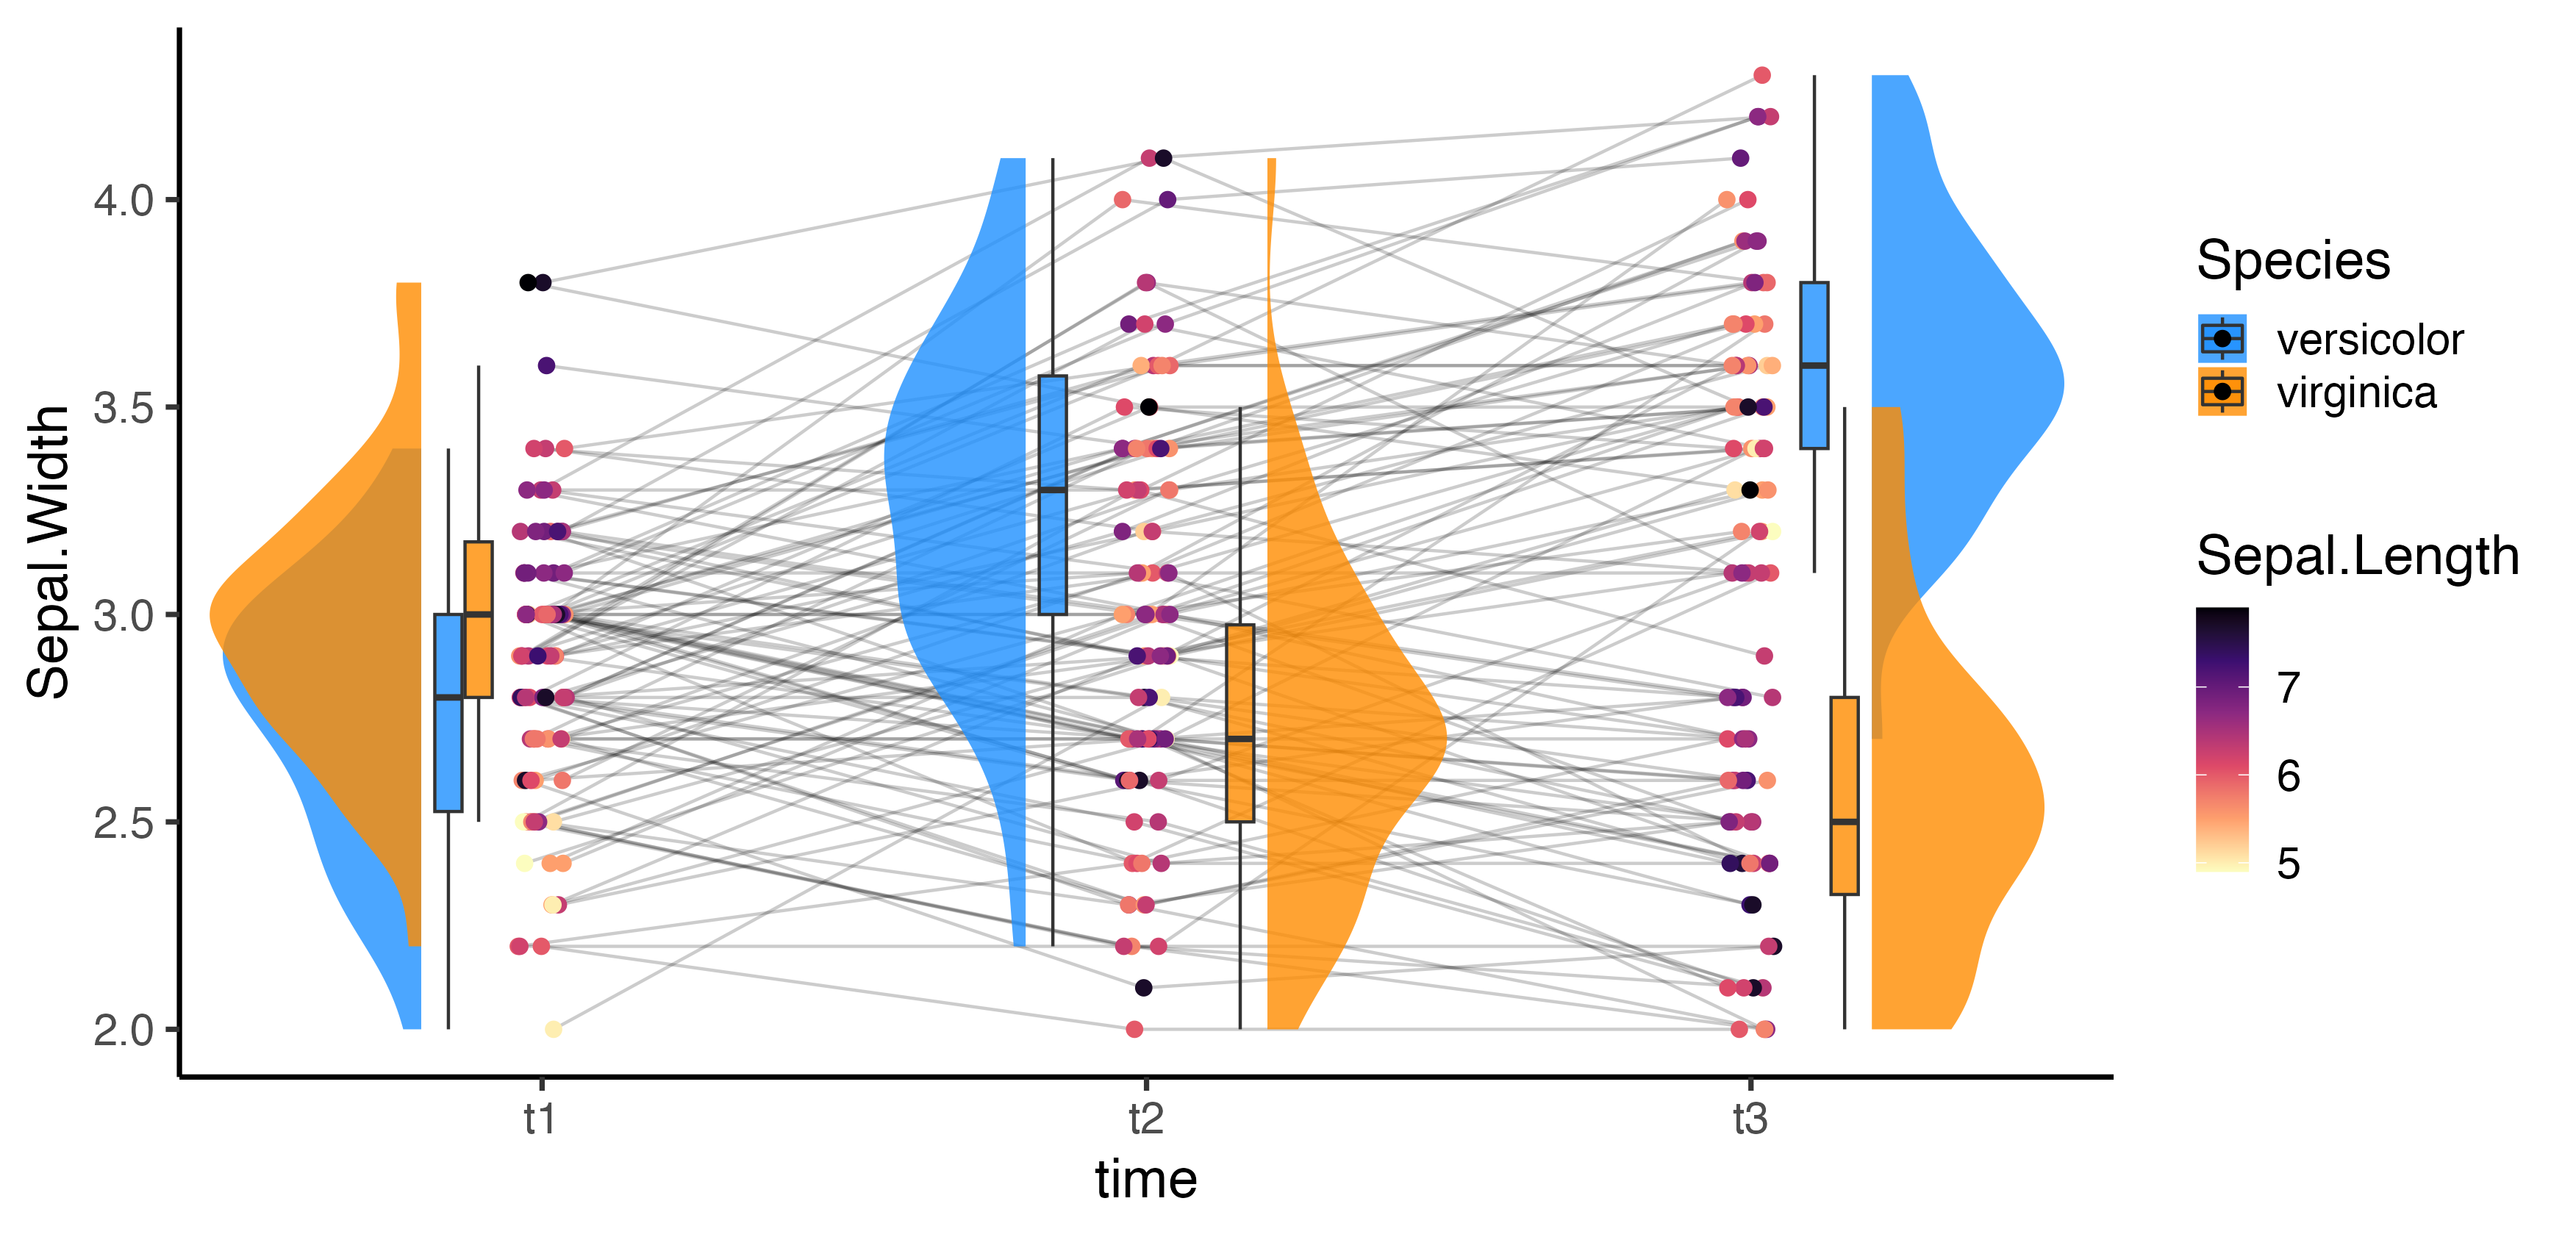
featuresgeom_rain is a combination of 4 different ggplot2 geom’s
(i.e., point, line, boxplot & violin).
id.long.var: a grouping variable to connect the lines
bycov: a covariate to remap the color of the pointsLikert: True or False
response which adds y jitteringrain.side: Which side to display the rainclouds: ‘l’
for left, ‘r’ for right and ‘f’ for flankingSpecific geom arguments can be passed with a list to any of the 4
geom’s with the argument {point/line/boxplot/violin}.args.
For a list of arguments that can be passed see the help files of the
respective geom’s (e.g., ?gghalves::geom_half_violin).
Position-related arguments (e.g., jittering, nudging & width) can
be passed with {point/line/boxplot/violin}.args.pos, see
the help file of ?geom_rain for defaults
We warmly welcome all contributions. You can open an issue or make a pull request if you would like to add something new!
ggrain
* Robison, M. K., Celaya, X., Ball, B. H., & Brewer, G. A. (2024).
    Task sequencing does not systematically affect the factor structure of cognitive abilities.
    Psychonomic Bulletin & Review, 31(2), 670-685.
    https://doi.org/10.3758/s13423-023-02369-0
* Han, C., Danzeng, Q., Li, L., Bai, S., & Zheng, C. (2024).
    Machine learning reveals PANoptosis as a potential reporter and
    prognostic revealer of tumour microenvironment in lung adenocarcinoma.
    The Journal of Gene Medicine, 26(1), e3599.
    https://doi.org/10.1002/jgm.3599
* Jiang, S., Shang, W. Z., Cui, J. Y., Yan, Y. Y., Yang, T., Hu, Y., ... & Wu, B. (2023).
    Prevalence and Predictors of Hemorrhagic Foci on Long-term
    Follow-up MRI of Recent Single Subcortical Infarcts.
    Translational Stroke Research, 1-11.
    https://doi.org/10.1007/s12975-023-01224-7
* Senftleben, U., Schoemann, M., & Scherbaum, S. (2024).
    Choice repetition bias in intertemporal choice: An eye-tracking study.
    OSF (Open Science Framework) / PsyArXiv.
    https://doi.org/10.31234/osf.io/g3v9m
* Bognar, M., Gyurkovics, M., Aczel, B., & van Steenbergen, H. (2023).
    The curve of control: Non-monotonic effects of task difficulty on cognitive control.
    PsyArXiv
    https://doi.org/10.31234/osf.io/ywup9

In 2021, NWO (Dutch research council) announced their inaugural NWO Open Science Fund. The Open Science Fund aims to support researchers to develop, test and implement innovative ways of making research open, accessible, transparent and reusable, covering the whole range of Open Science. The Raincloud plots team was awarded this fantastic initiative and is specifically working on:
ggrain
R-packageraincloudplotsYou can read more about our awarded project here:
https://www.nwo.nl/en/projects/203001011 or you can watch the online
webinar hosted by NWO about our project: 
- Allen, M., Poggiali, D., Whitaker, K., Marshall, T. R., van Langen, J., & Kievit, R. A.
    Raincloud plots: a multi-platform tool for robust data visualization [version 2; peer review: 2 approved]
    Wellcome Open Research 2021, 4:63. https://doi.org/10.12688/wellcomeopenres.15191.2
There are now 4 ways in which you can use
our Raincloud Plots tools: - through a series of specific easy to modify
scripts https://github.com/RainCloudPlots/RainCloudPlots
- through our initial raincloudplots
package - through the newest R-package ggrain - through
our R Shiny application: raincloudplots