ggnuplot is a ggplot2 theme that makes your ggplots look like gnuplots. This may be helpful if you use both ggplot2 and gnuplot in one project.
You can install the development version of ggnuplot from GitHub with:
# install.packages("devtools")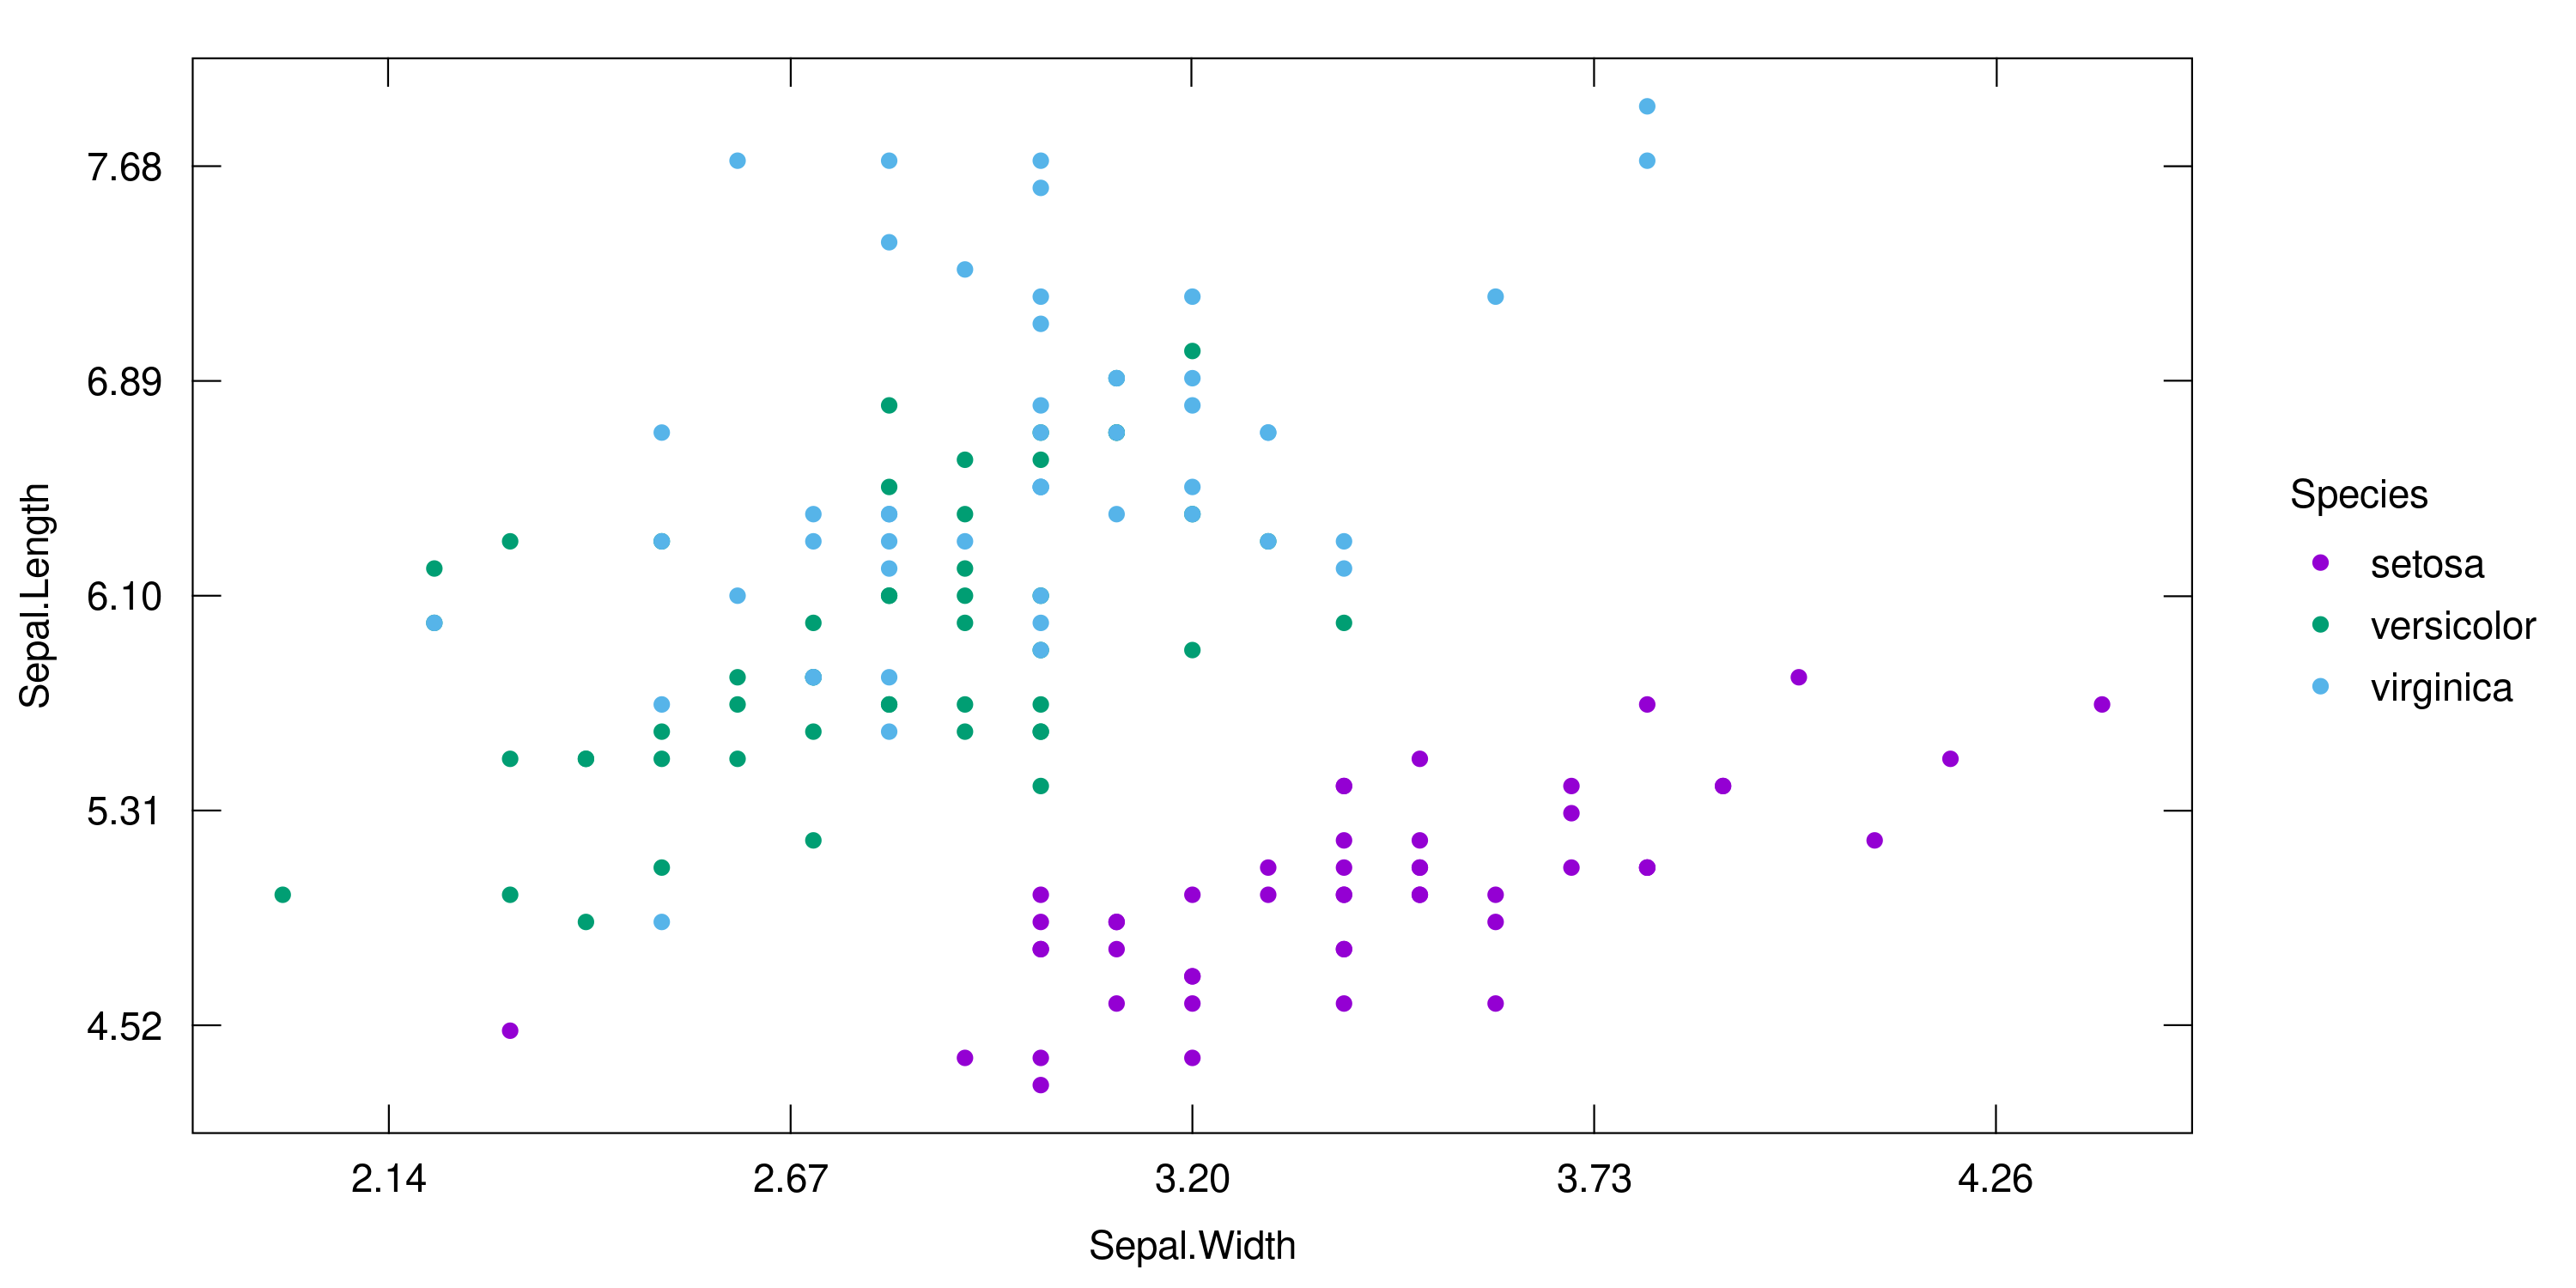
devtools::install_github("hriebl/ggnuplot")ggnuplot features inward ticks and secondary axes. It also comes with gnuplot’s default color palette. Here is what it looks like:
library(ggplot2)
library(ggnuplot)

ggplot(iris, aes(Sepal.Width, Sepal.Length, color = Species)) +
  geom_point() +
  scale_color_gnuplot() +
  scale_x_gnuplot() +
  scale_y_gnuplot() +
  theme_gnuplot()
And one example with facets:
set.seed(1337)

df <- data.frame(
  y = rnorm(2000),
  x = rep(1:500, times = 4),
  cat1 = rep(c("Foo", "Bar", "Foo", "Bar"), each = 500),
  cat2 = rep(c("Wibble", "Wobble"), each = 1000)
)

ggplot(df, aes(x, y)) +
  geom_line(color = gnucolors[1]) +
  geom_smooth(color = gnucolors[1], size = 1.5, se = FALSE) +
  facet_grid(vars(cat1), vars(cat2)) +
  xlab("MCMC Iterations") +
  ylab(NULL) +
  scale_x_gnuplot(expand = c(0, 0)) +
  scale_y_gnuplot(limits = c(-3.5, 3.5)) +
  theme_gnuplot()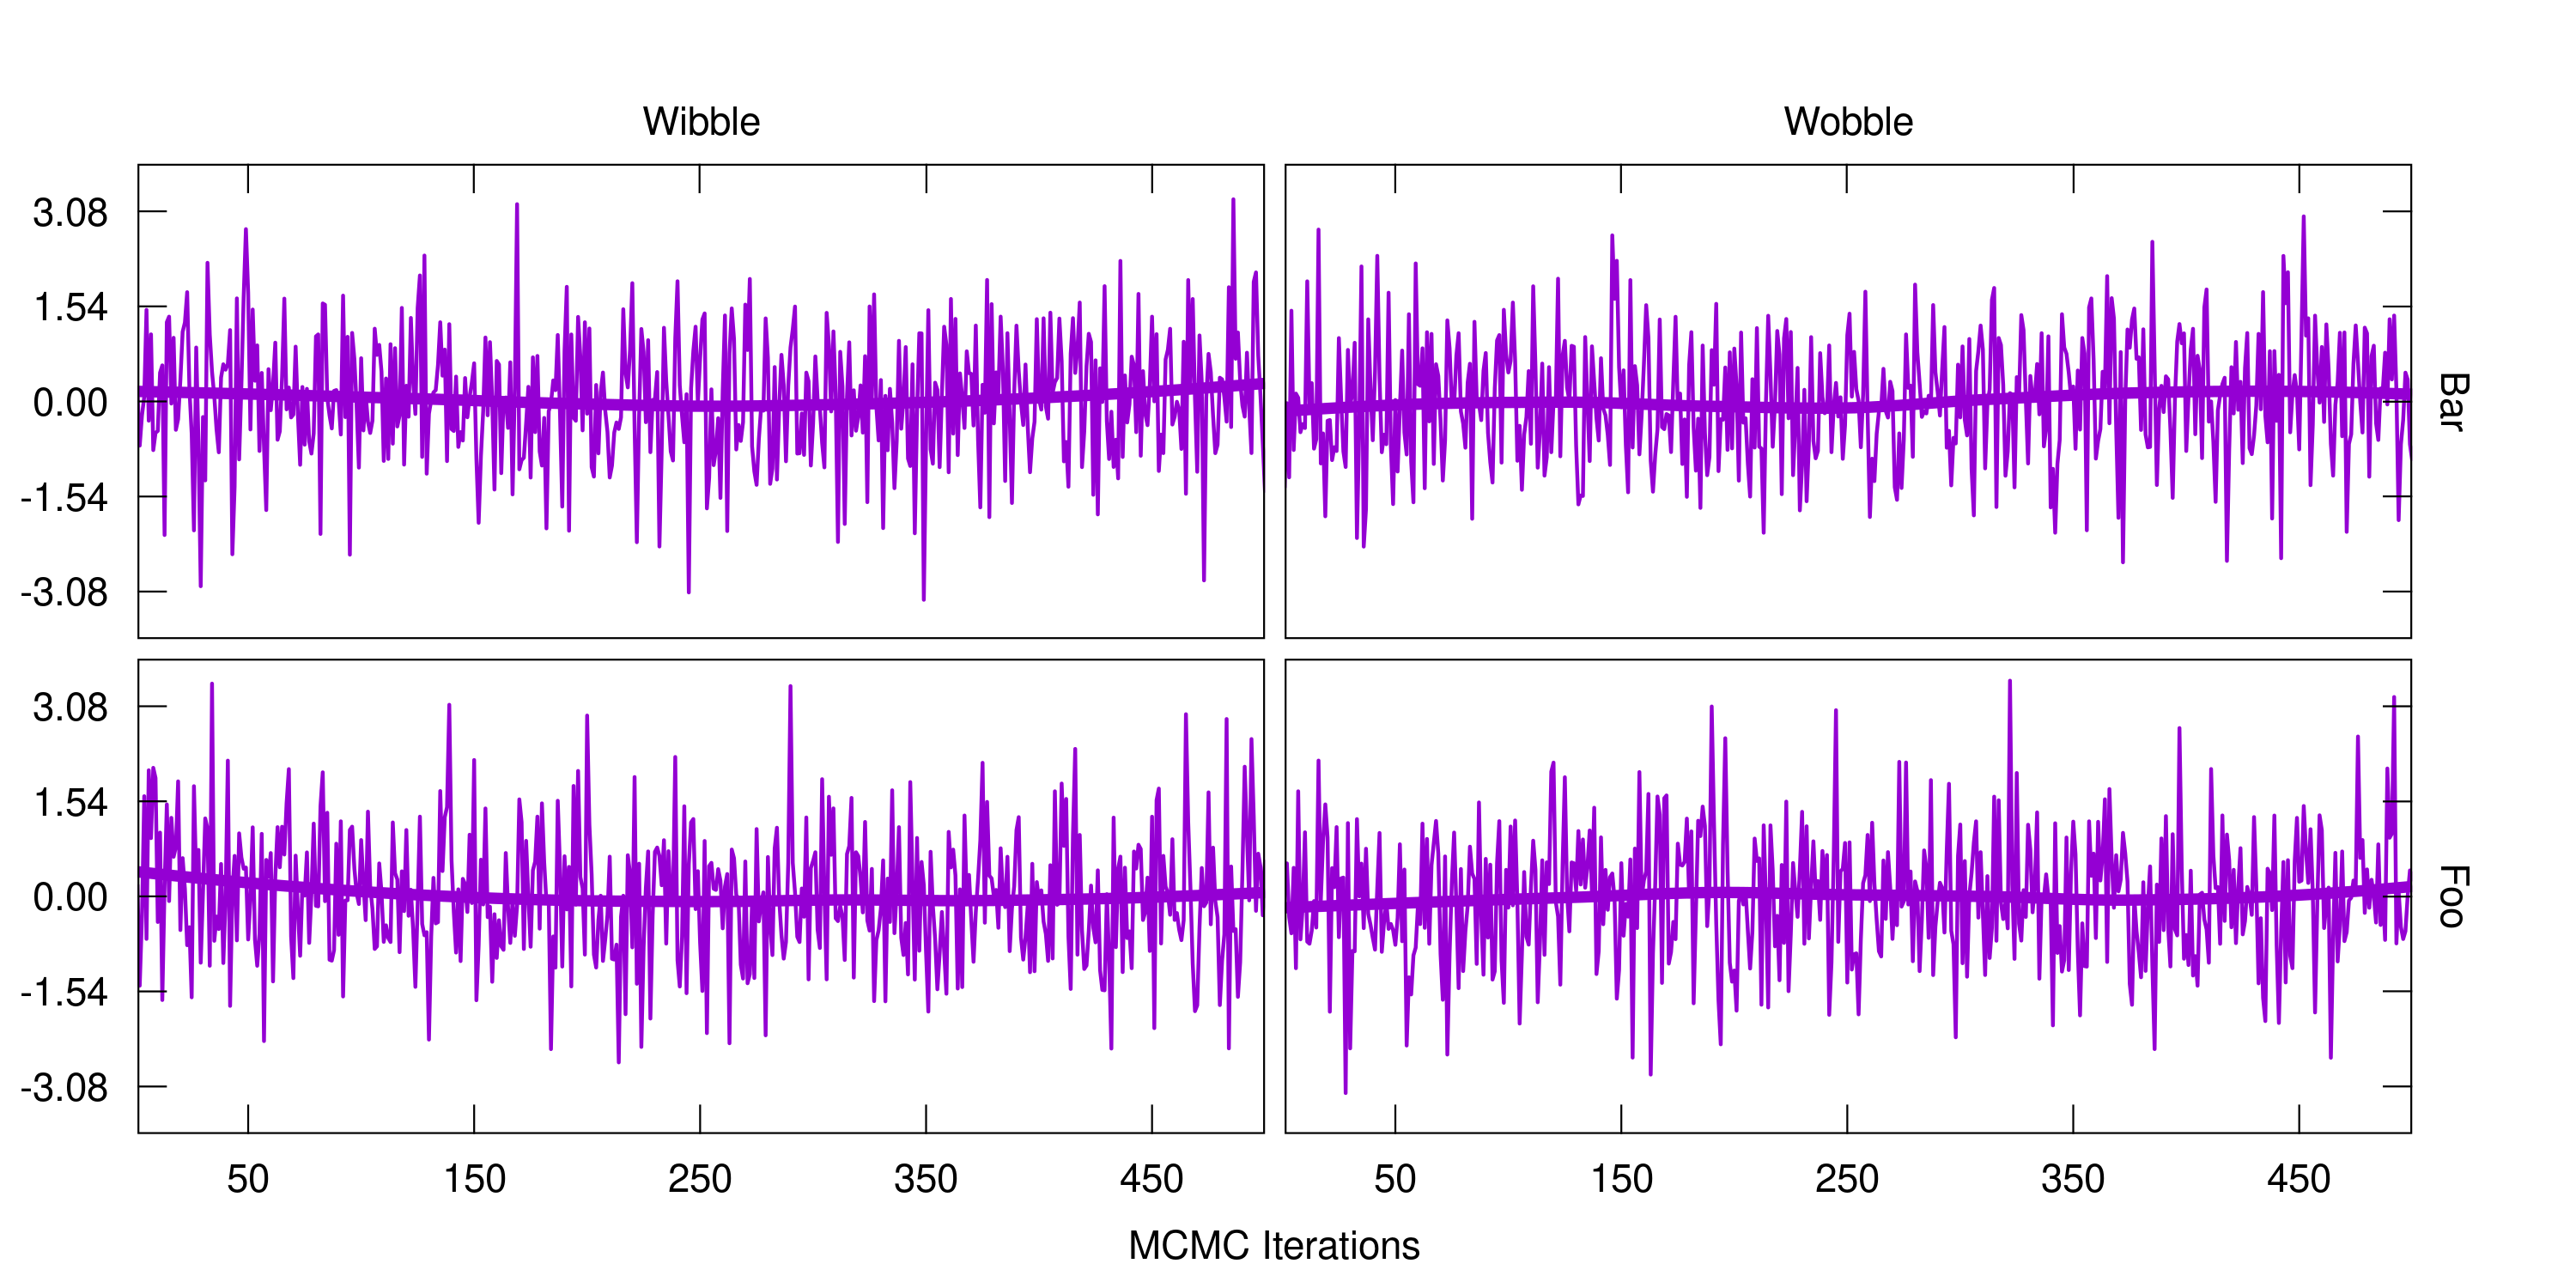
I wish my samplers worked that well!