
![]()
fec16 contains data from the Federal Election Commission (FEC) website pertaining to candidates, committees, results, contributions from committees and individuals, and other financial data for the United States 2015-2016 election cycle. Additionally, for the datasets that are included as samples, the package includes functions that import the full versions.
Get the latest released version from CRAN:
install.packages("fec16")Or the development version from GitHub:
# If you haven't installed the remotes package yet, do so:
# install.packages("remotes")
remotes::install_github("baumer-lab/fec16")
# Load package
library(fec16)candidates: candidates registered with the FEC during
the 2015-2016 election cyclecommittees: committees registered with the FEC during
the 2015-2016 election cyclecampaigns: the House/Senate current campaignsresults_house: the House results of the 2016 general
electionresults_senate: the Senate results of the 2016 general
electionresults_president: the final results of the 2016
general electionpac: Political Action Committee (PAC) and party summary
financial informationstates: geographical information about the 50
statesindividuals: individual contributions to
candidates/committees during the 2016 election cyclecontributions: candidates and their contributions from
committees during the 2016 election cycleexpenditures: the operating expenditurestransactions: transactions between committeesThe following functions retrieve the entire datasets for the sampled
ones listed above. The size of the raw file that is downloaded by
calling each function is given for reference. All functions have an
argument n_max which defaults to the entire dataset but the
user can specify the max length of the dataset to be loaded via this
argument.
read_all_individuals() ~ 1.45GBread_all_contributions() ~ 15.4MBread_all_expenditures() ~ 52.1MBread_all_transactions() ~ 79.2MBThe headers of each table show the dataset name. The underlined variables are primary keys while all the others are foreign keys. The arrows show how the datasets are connected.
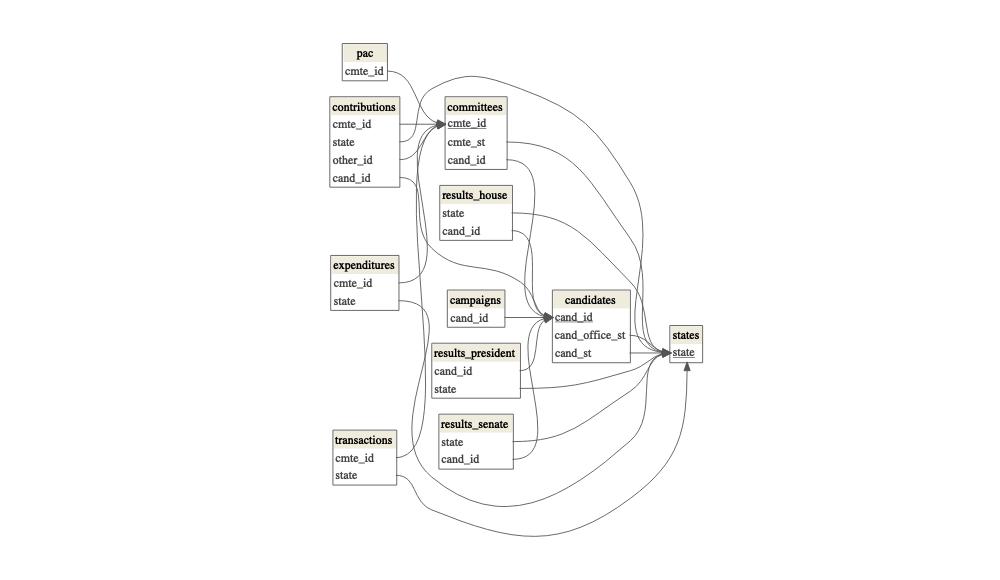
The diagram is built using the dm R package. The code
can be found in data-raw/dm.R.
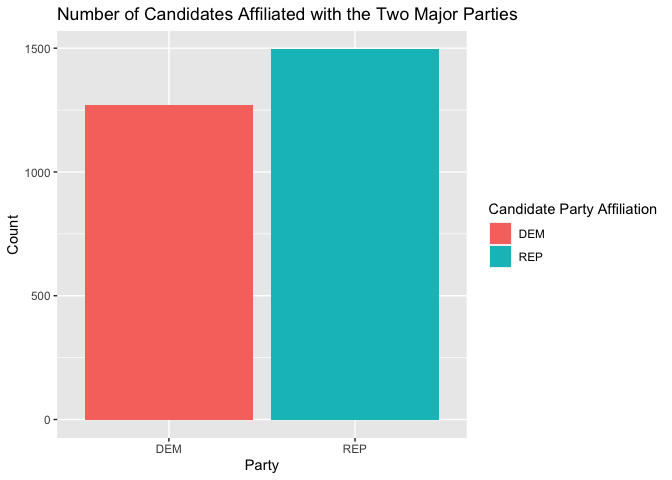
fec16 can be used to summarize data in order see how
many candidates are running for elections (in all offices) for the two
major parties:
library(dplyr)

data <- candidates %>%
  filter(cand_pty_affiliation %in% c("REP", "DEM")) %>%
  group_by(cand_pty_affiliation) %>%
  summarize(size = n())

data
#> # A tibble: 2 × 2
#>   cand_pty_affiliation  size
#>   <chr>                <int>
#> 1 DEM                   1270
#> 2 REP 1495We can visualize the above data:
library(ggplot2)

ggplot(data, aes(x = cand_pty_affiliation, y = size, fill = cand_pty_affiliation)) +
  geom_col() +
  labs(
    title = "Number of Candidates Affiliated with the Two Major Parties",
    x = "Party", y = "Count", fill = "Candidate Party Affiliation"
  )
If you are interested in political data, check out the following related packages: