 dsb: Normalize and denoise antibody-derived-tag data from CITE-seq,
ASAP-seq, TEA-seq and related assays.
dsb: Normalize and denoise antibody-derived-tag data from CITE-seq,
ASAP-seq, TEA-seq and related assays.The dsb R package is available on CRAN: latest dsb
release
To install in R use install.packages('dsb')
Mulè,
Martins, and Tsang, Nature Communications (2022) describes
our deconvolution of ADT noise sources and development of dsb.
See notes on upstream processing before dsb
Recent Publications Check out recent publications that used dsb for ADT normalization.
The functions in this package return standard R matrix objects that
can be added to any data container like a
SingleCellExperiment, Seurat, or
AnnData related python objects.
Our paper combined experiments and computational approaches to find ADT protein data from CITE-seq and related assays are affected by substantial background noise. We observed that ADT reads from empty droplets—often more than tenfold the number of cell-containing droplets—closely match levels in unstained spike-in cells, and can also serve as a readout of protein-specific ambient noise. We also remove cell-to-cell technical variation by estimating a conservative adjustment factor derived from isotype control levels and per cell background derived from a per cell mixture model. The 2.0 release of dsb includes faster compute times and functions for normalization on datasets without empty drops.
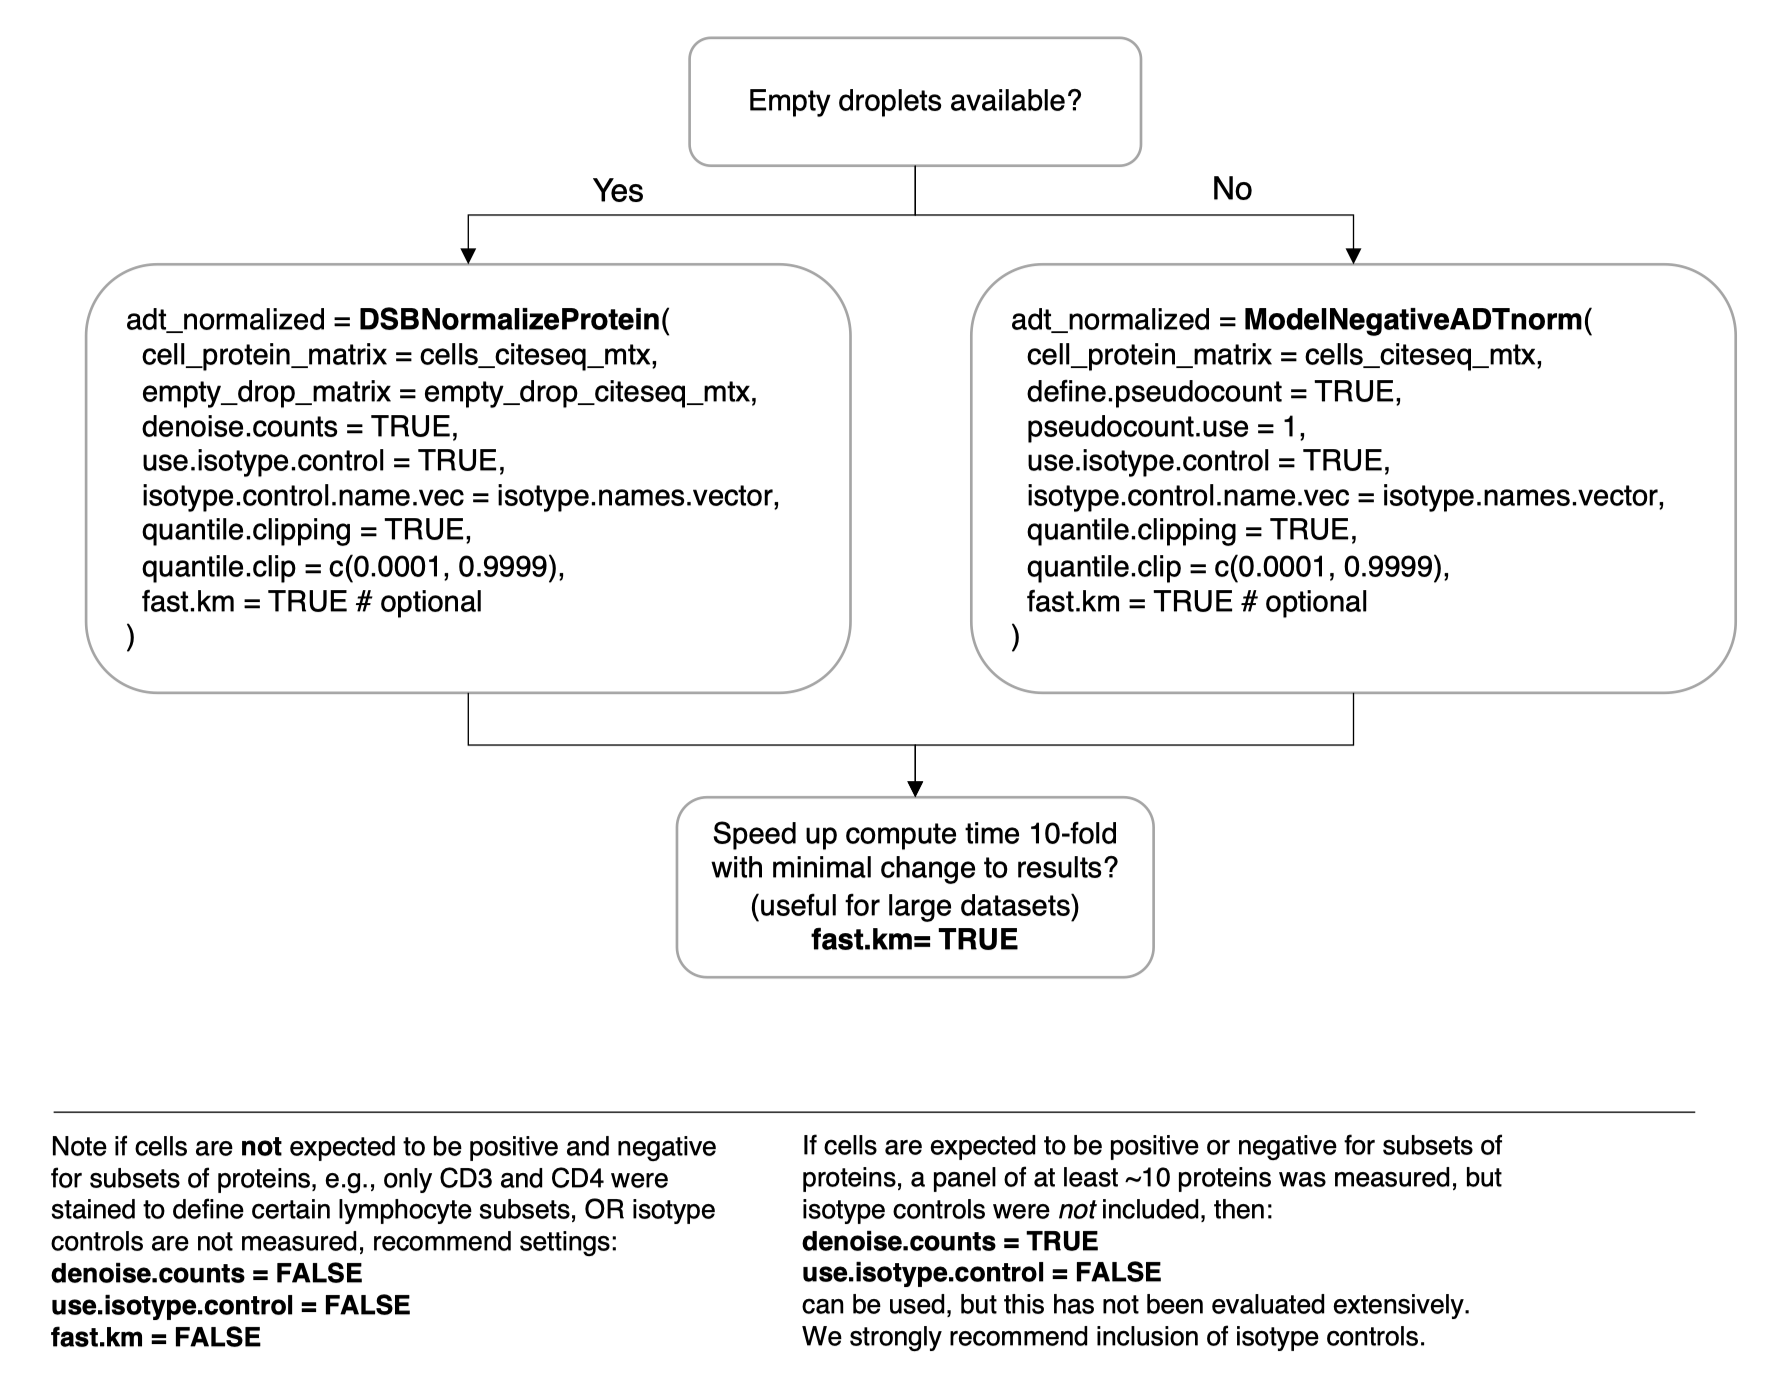
The default method is carried out in a single step with a call to the
DSBNormalizeProtein() function.
cells_citeseq_mtx - a raw ADT count matrix
empty_drop_citeseq_mtx - a raw ADT count matrix from
non-cell containing empty / background droplets.
denoise.counts = TRUE - define and remove the ‘technical
component’ of each cell’s protein library.
use.isotype.control = TRUE - include isotype controls in
the modeled dsb technical component.
# install.packages('dsb')
library(dsb)

isotype.names = c("MouseIgG1kappaisotype_PROT", "MouseIgG2akappaisotype_PROT",
                  "Mouse IgG2bkIsotype_PROT", "RatIgG2bkIsotype_PROT")

adt_norm = DSBNormalizeProtein(
  cell_protein_matrix = cells_citeseq_mtx,
  empty_drop_matrix = empty_drop_citeseq_mtx,
  denoise.counts = TRUE,
  use.isotype.control = TRUE,
  isotype.control.name.vec = isotype.names,
  fast.km = TRUE # optional
)Not all datasets have empty droplets available, for example those downloaded from online repositories where only processed data are included. We provide a method to approximate the background distribution of proteins based on data from cells alone. Please see the vignette Normalizing ADTs if empty drops are not available for more details.
adt_norm = ModelNegativeADTnorm(
  cell_protein_matrix = cells_citeseq_mtx,
  denoise.counts = TRUE,
  use.isotype.control = TRUE,
  isotype.control.name.vec = isotype.names,
  fast.km = TRUE # optional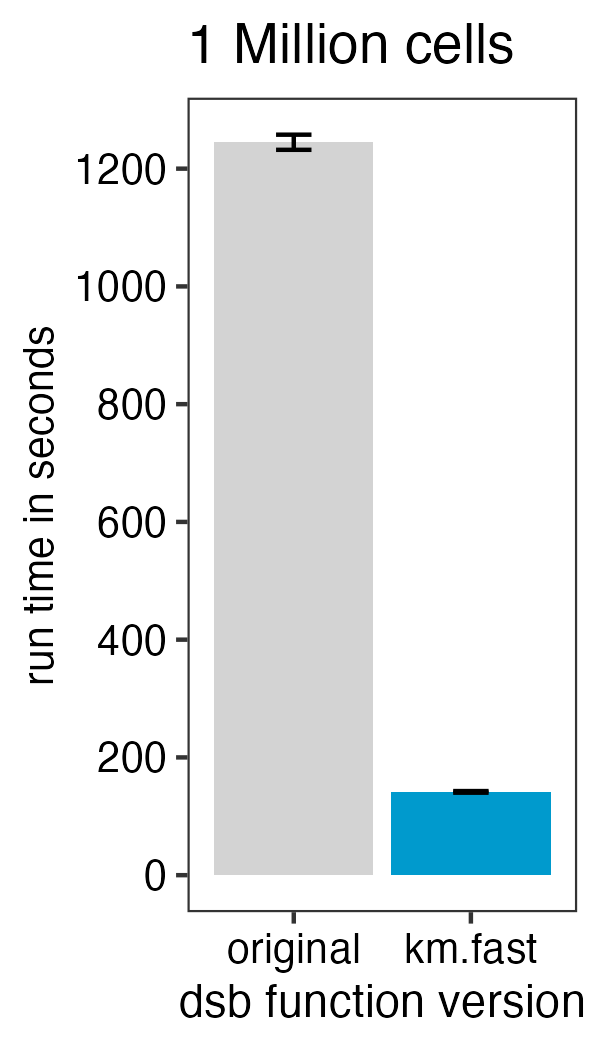
)To speed up the function 10-fold with minimal impact on the results
from those in the default function set fast.km = TRUE with
either the DSBNormalizeProtein or
ModelNegativeADTnorm functions. See the new vignette
on this topic.
See the simple visual guide below. Please search the resolved issues on github for questions or open a new issue if your use case has not been addressed.
Any alignment software can be used prior to normalization with dsb.
To use the DSBNormalizeProtein function described in the
manuscript, you need to define cells and empty droplets from the
alignment files. Any alignment pipeline can be used. Some examples
guides below:
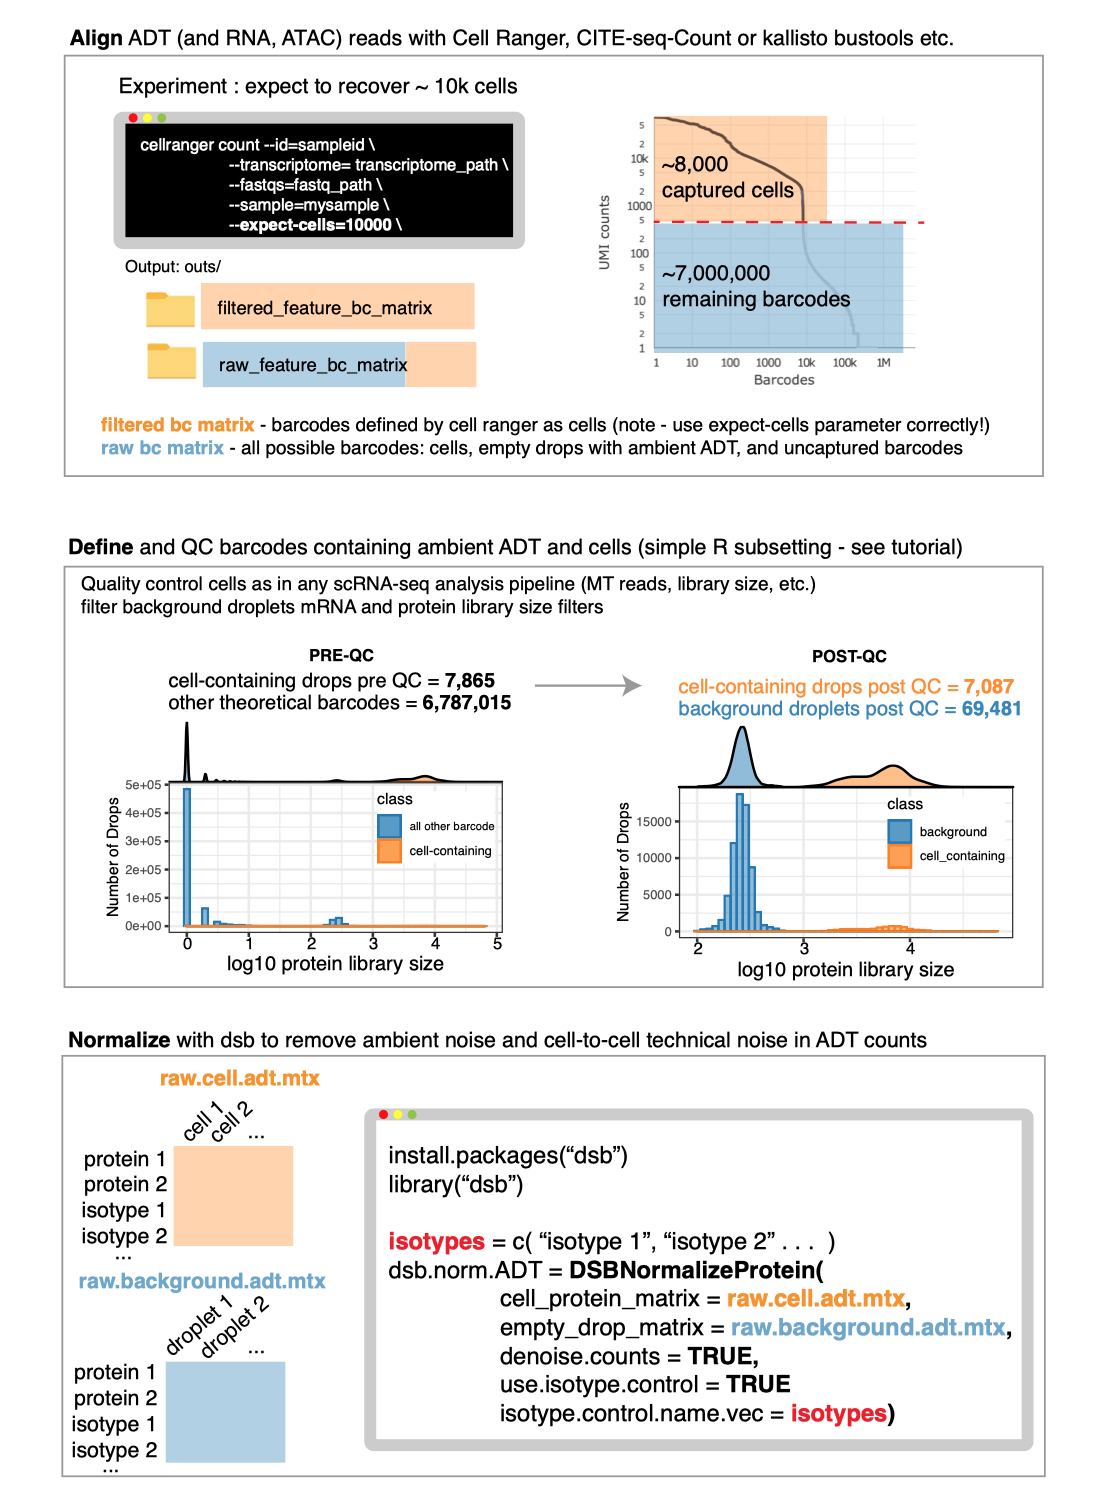
See the “end
to end” vignette for information on defining cells and background
droplets from the output files created from Cell Ranger as in the
schematic below.
Please note whether or not you use dsb, to define cells using
the filtered_feature_bc_matrix file from Cell Ranger, you
need to properly set the --expect-cells argument to roughly
your estimated cell recovery per lane based on how many cells you
loaded. see the
note from 10X about this. The default value of 3000 is likely not
suited to most modern experiments.
# Cell Ranger alignment
cellranger count --id=sampleid\
--transcriptome=transcriptome_path\
--fastqs=fastq_path\
--sample=mysample\
--expect-cells=10000\
See end to end vignette for detailed information on using Cell Ranger
output.
Important: set the -cells argument in
CITE-seq-Count to ~ 200000. This aligns the top 200000
barcodes per lane by ADT library size.
CITE-seq-count
documentation
# CITE-seq-Count alignment
CITE-seq-Count -R1 TAGS_R1.fastq.gz  -R2 TAGS_R2.fastq.gz \
 -t TAG_LIST.csv -cbf X1 -cbl X2 -umif Y1 -umil Y2 \
-cells 200000 -o OUTFOLDERI recommend following the comprehensive tutorials by Tommy Tang for
using Alevin, DropletUtils and dsb for CITE-seq normalization.
ADT
alignment with Alevin
DropletUtils
and dsb from Alevin output
Alevin
documentation
I recommend checking out the tutorials and example code below to
understand how to use kallisto bustools outputs with dsb.
kallisto
bustools tutorial by Sarah Ennis
dsb
normalization using kallisto outputs by Terkild Brink Buus
kallisto
bustools documentation
Example script
kb count -i index_file -g gtf_file.t2g -x 10xv3 \
-t n_cores  -o output_dir \
input.R1.fastq.gz input.R2.fastq.gz
After alignment define cells and background droplets empirically with protein and mRNA based thresholding as outlined in the main tutorial.
From other groups
Singhaviranon
Nature Immunology 2025
Yayo Nature
2024
Izzo
et al. Nature 2024
Arieta et
al. Cell 2023
Magen et
al. Nature Medicine 2023
COMBAT consortium
Cell 2021
Jardine et
al. Nature 2021
Mimitou et
al. Nature Biotechnology 2021
From the Tsang lab
Mulè
et al. Immunity 2024
Sparks et
al. Nature 2023
Liu et
al. Cell 2021
Kotliarov et
al. Nature Medicine 2020
Topics covered in other vignettes on CRAN
Integrating dsb with Bioconductor, integrating dsb with
python/Scanpy
Using dsb with data lacking isotype controls
integrating dsb with sample multiplexing experiments
using dsb on data with multiple batches
using a different scale / standardization based on empty droplet
levels
Returning internal stats used by dsb
outlier clipping with the quantile.clipping argument
other FAQ