![]()
![]()
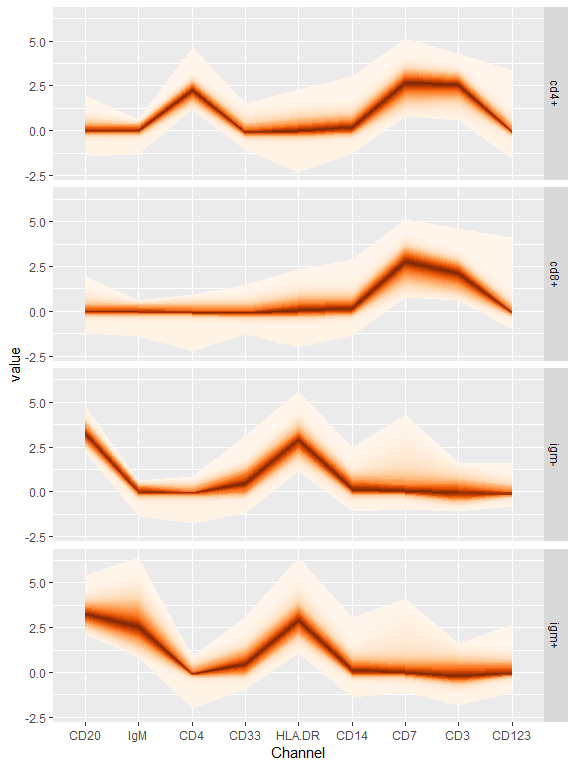
cytofan implements the concept of fan plots (Britton,
E.; Fisher, P. & J. Whitley (1998) The Inflation Report Projections:
Understanding the Fan Chart) for cytometry data in ggplot2.
The cytofan package was implemented following up on a gist
written shortly after the fanplot package
was released. Compared to ggfan,
cytofan uses categorical data as input on the x axis.
You can install cytofan from github with:
# install.packages("devtools")
devtools::install_github("yannabraham/cytofan")cytofan can be used to visualize differences between
populations identifed using mass cytometry:
library(cytofan)
#> Loading required package: ggplot2
library(bodenmiller)
library(dplyr)
#>
#> Attaching package: 'dplyr'
#> The following objects are masked from 'package:stats':
#>
#>     filter, lag
#> The following objects are masked from 'package:base':
#>
#>     intersect, setdiff, setequal, union
library(tidyr)

data("refPhenoMat")
data("refAnnots")

bind_cols(refAnnots,
          as.data.frame(refPhenoMat)) %>%
  filter(Cells %in% c('cd4+','cd8+','igm+','igm-')) %>%
  gather("Channel","value",
         any_of(colnames(refPhenoMat))) %>%
  ggplot(aes(x=Channel,y=value))+
  geom_fan()+
  facet_grid(Cells~.)