![]()
The goal of colorplane is to facilitate the creation and
manipulation of color maps that can be rescaled, thresholded, and
blended. The main motivation for the package was to help with the
creation of image overlays for the display of scalar fields on a
backgroound image (e.g. for display of brain activation maps).
You can install the development version of colorplane from GitHub with:
# install.packages("devtools")
devtools::install_github("bbuchsbaum/colorplane")We create two color planes that map from “intensity” to colors provided in a color map.
library(colorplane)

vals <- rnorm(100)
cmap <- IntensityColorPlane(vals, cols=rainbow(100))

## now we map to a set of colors, such that the color scale ranges from -1 to 1.
hexmap <- map_colors(cmap, irange=c(-1,1))
print(class(hexmap))
#> [1] "HexColorPlane"
#> attr(,"package")
#> [1] "colorplane"
plot(vals, col=hexmap@clr)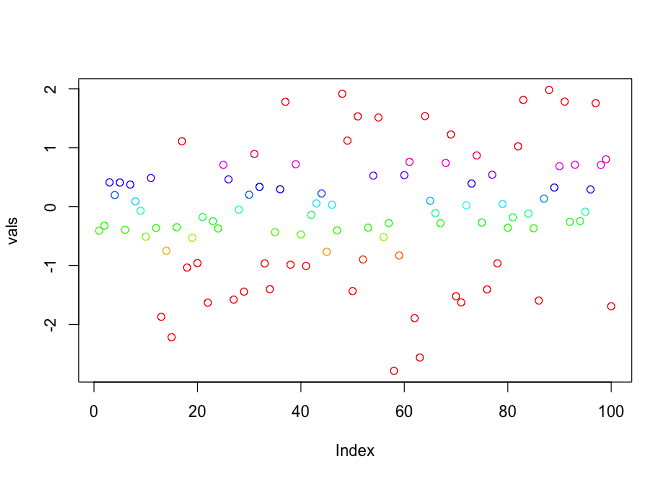
## let's do the same except threshold colors in the range [-.5,.5]
cmap2 <- map_colors(cmap, irange=c(-1,1), threshold=c(-.5,.5))

## cmap2 is an RGBColorPlane because we added element-wise transparency due to thresholding.
## We can convert back to hexcolors to plot.
print(class(cmap2))
#> [1] "RGBColorPlane"
#> attr(,"package")
#> [1] "colorplane"

## Note value between [-.5,.5] are now invisible.
plot(vals, col=as_hexcol(cmap2))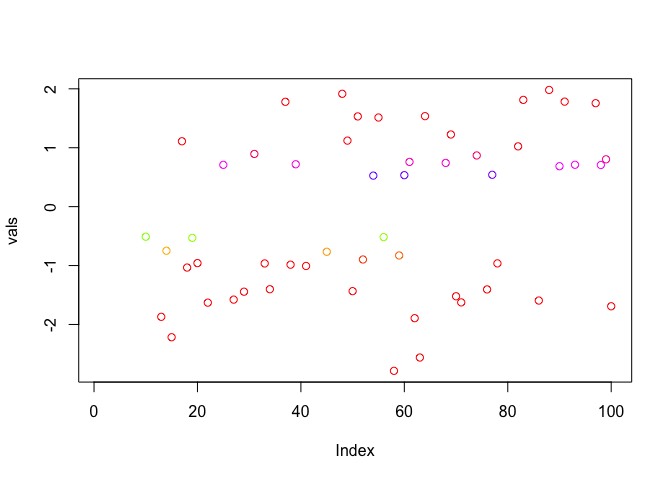
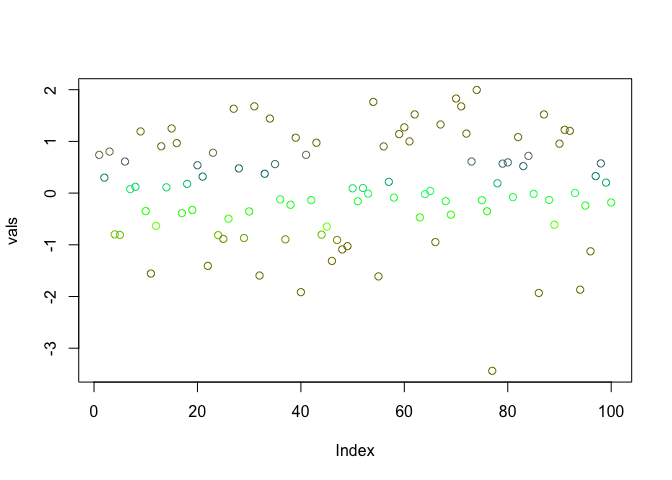
We can also blend colors using alpha composition. Here we simply give all colors a greenish tint to demonstrate color blending.
library(colorplane)

vals <- rnorm(100)
bottom <- map_colors(IntensityColorPlane(vals, cols=rainbow(100)),irange=c(-1,1))
top <- ConstantColorPlane("#00FF00")

blend <- blend_colors(bottom, top, alpha=.5)
plot(vals, col=as_hexcol(blend))