![]()
This R package retrieves zonal statistics from weather indicators that were calculated for each municipality in Brazil using data from the BR-DWGD and TerraClimate projects.
Zonal statistics such as mean, maximum, minimum, standard deviation, and sum were computed by taking into account the data cells that intersect the boundaries of each municipality and stored in Parquet files. This procedure was carried out for all Brazilian municipalities, and for all available dates, for every indicator available in the weather products (BR-DWGD and TerraClimate projects). This package queries on-line the already calculated statistics on the Parquet files and returns easy-to-use data.frames.
Details about the used methodology to calculate the zonal statistics are available at Articles > Methodology.
install.packages("brclimr")remotes::install_github(repo = "rfsaldanha/brclimr")To fetch data for a specific product, indicator and statistic, use
the fetch_data function. For example: Rio de Janeiro, RJ
(IBGE code number 3304557), data product “brdwgd”, average relative
humidity, from 2010-10-15 to 2010-10-20.
library(brclimr)

fetch_data(
    code_muni = 3304557,
    product = "brdwgd",
    indicator = "rh",
    statistics = "mean",
    date_start = as.Date("2010-10-15"),
    date_end = as.Date("2010-10-20")
  )
#>         date    value
#> 1 2010-10-15 74.48010
#> 2 2010-10-16 73.53403
#> 3 2010-10-17 77.84841
#> 4 2010-10-18 90.10590
#> 5 2010-10-19 74.33522
#> 6 2010-10-20 71.50061
If you need to query several municipalities, indicators and zonal
statistics, we recommend to download and locally query the parquet files
using the arrow package. A list of URLs of the parquet
files created for this project is available at Articles > Parquet
files.
A list with the indicators and zonal statistics available by product
can be retrieved with the function product_info.
product_info("brdwgd")
product_info("terraclimate")tmax <- fetch_data(
code_muni = 3303401,
product = "brdwgd",
indicator = "tmax",
statistics = "mean",
date_start = as.Date("2010-01-01"),
date_end = as.Date("2012-01-01")
)
tmin <- fetch_data(
code_muni = 3303401,
product = "brdwgd",
indicator = "tmin",
statistics = "mean",
date_start = as.Date("2010-01-01"),
date_end = as.Date("2012-01-01")
)
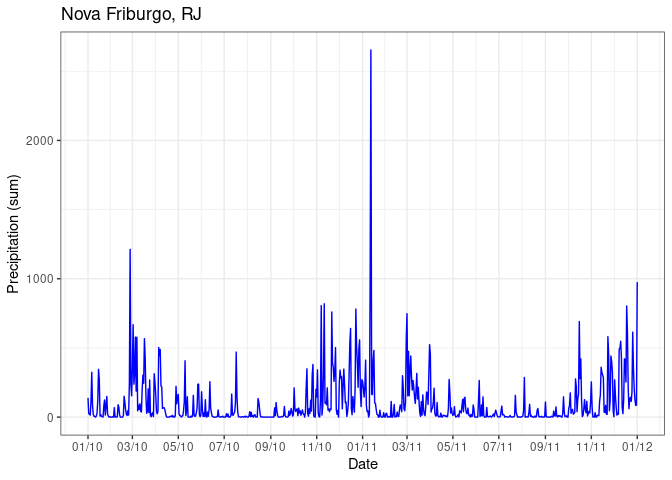
pr <- fetch_data(
code_muni = 3303401,
product = "brdwgd",
indicator = "pr",
statistics = "sum",
date_start = as.Date("2010-01-01"),
date_end = as.Date("2012-01-01")
)
tmax$name <- "Tmax_avg"
tmin$name <- "Tmin_avg"library(ggplot2)
ggplot(data = rbind(tmax, tmin), aes(x = date, y = value, color = name)) +
geom_line() +
scale_x_date(date_breaks = "2 months", date_labels = "%m/%y") +
ylim(0, NA) +
labs(
title = "Nova Friburgo, RJ",
x = "Date",
y = "Temperature (average)",
color = ""
) +
theme_bw() +
theme(legend.position = "bottom", legend.direction = "horizontal")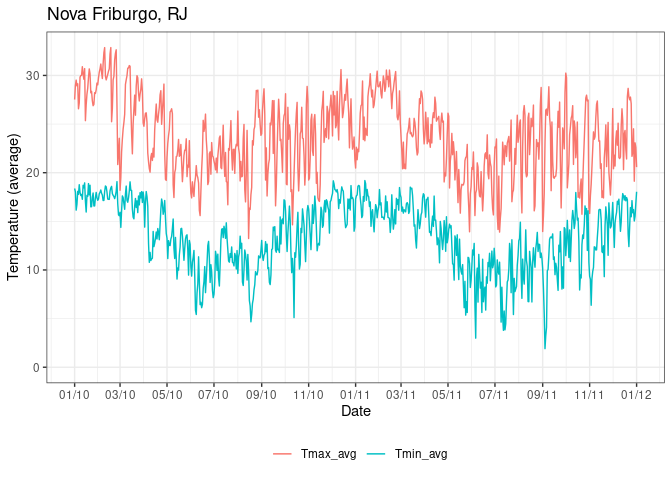
ggplot(data = pr, aes(x = date, y = value)) +
  geom_line(color = "blue") +
  scale_x_date(date_breaks = "2 months", date_labels =  "%m/%y") +
  ylim(0, NA) +
  labs(
    title = "Nova Friburgo, RJ",
    x = "Date",
    y = "Precipitation (sum)",
    color = ""
  ) +
  theme_bw() +
  theme(legend.position = "bottom", legend.direction = "horizontal")