This package implements fuzzy DBScan with fuzzy core and fuzzy
border. Therefore, it provides a method to initialize and run the
algorithm and a function to predict new data w.t.h. of R6.
The package is build upon the paper “Fuzzy Extensions of the DBScan
algorithm” from Dino Ienco and Gloria Bordogna. The predict function
assigns new data based on the same criteria as the algorithm itself.
However, the prediction function freezes the algorithm to preserve the
trained cluster structure and treats each new prediction object
individually.
You can install the development version of FuzzyDBScan from GitHub with:
# install.packages("devtools")
devtools::install_github("henrifnk/FuzzyDBScan")The following example shows how Fuzzy DBScan works with the
multishapes data set from the factoextra
package. We set the range of \(\epsilon \in
[0, 0.2]\). Note that setting \(\epsilon_{min} = 0\) implies that we expect
fuzzieness through the entire core. The range of neighbors is set to the
interval of \([3, 15]\) where \(pts_{min} = 3\) means that we need at least
three points to detect a fuzzy core point.
library(factoextra)
dta = multishapes[, 1:2]
eps = c(0, 0.2)
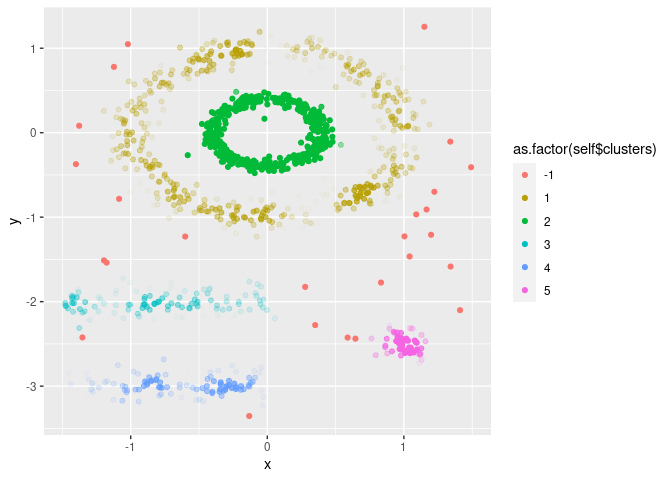
pts = c(3, 15)Next, we train the DBScan based on dta, eps
and pts. This is done by initializing the R6
object. FuzzyDBScan contains a scatterplot method, where
the clusters (colours) and fuzzieness (transparency) are plotted for any
two features.
library(FuzzyDBScan)
cl = FuzzyDBScan$new(dta, eps, pts)
cl$plot("x", "y")
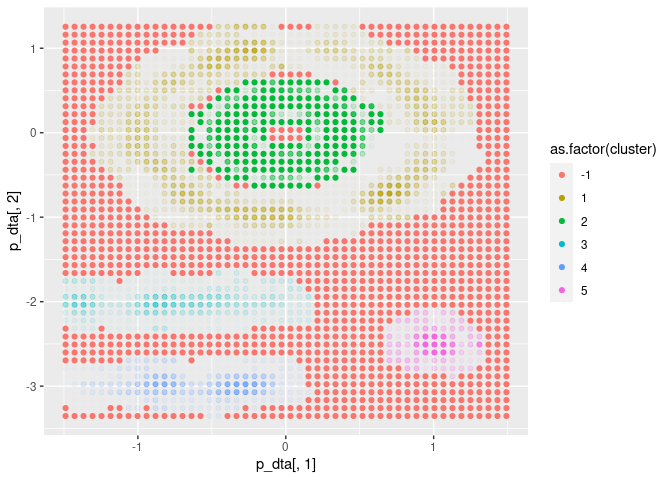
FuzzyDBScan is equipped with a prediction method. This
method freezes the algorithm such that new data points are not used for
updating the cluster structure itself.<s Each new data point is then
assigned a cluster and fuzziness individually by the same rules as
during training.
x <- seq(min(dta$x), max(dta$x), length.out = 50)
y <- seq(min(dta$y), max(dta$y), length.out = 50)
p_dta = expand.grid(x = x, y = y)

p = cl$predict(p_dta, FALSE)
ggplot(p, aes(x = p_dta[, 1], y = p_dta[, 2], colour = as.factor(cluster))) +
  geom_point(alpha = p$dense)