
![]()

R
Code to download Datasets from Kenneth
French’s famous website.Version 1.1.1 corrects a small error for publication on CRAN.
One often needs those datasets for further empirical work and it is a tedious effort to download the (zipped) csv, open and then manually separate the contained datasets. This package downloads them automatically, and converts them to a list of xts-objects that contain all the information from the csv-files.
Original code from MasimovR https://github.com/MasimovR/. Was then heavily redacted by me.
You can install FFdownload from CRAN with
install.packages("FFdownload")or directly from github with:
# install.packages("devtools")
devtools::install_github("sstoeckl/FFdownload")In this example, we use FFDwonload to
library(FFdownload)
temptxt <- tempfile(fileext = ".txt")
# Example 1: Use FFdownload to get a list of all monthly zip-files. Save that list as temptxt.
FFdownload(exclude_daily=TRUE,download=FALSE,download_only=TRUE,listsave=temptxt)
FFlist <- readr::read_csv(temptxt) %>% dplyr::select(2) %>% dplyr::rename(Files=x)
FFlist %>% dplyr::slice(1:3,(dplyr::n()-2):dplyr::n())
#> # A tibble: 6 × 1
#> Files
#> <chr>
#> 1 F-F_Research_Data_Factors_CSV.zip
#> 2 F-F_Research_Data_Factors_weekly_CSV.zip
#> 3 F-F_Research_Data_Factors_daily_CSV.zip
#> 4 Emerging_Markets_4_Portfolios_BE-ME_OP_CSV.zip
#> 5 Emerging_Markets_4_Portfolios_OP_INV_CSV.zip
#> 6 Emerging_Markets_4_Portfolios_BE-ME_INV_CSV.zipinputlist to only download the datasets we actually
need.tempd <- tempdir()
inputlist <- c("F-F_Research_Data_Factors","F-F_Momentum_Factor","F-F_ST_Reversal_Factor","F-F_LT_Reversal_Factor")
FFdownload(exclude_daily=TRUE,tempd=tempd,download=TRUE,download_only=TRUE,inputlist=inputlist)tempf <- paste0(tempd,"\\FFdata.RData")
getwd()
#> [1] "/home/sstoeckl/Packages/ffdownload"
FFdownload(output_file = tempf, exclude_daily=TRUE,tempd=tempd,download=FALSE,
download_only=FALSE,inputlist = inputlist, format="tbl")
#> | | | 0% | |================== | 25% | |=================================== | 50% | |==================================================== | 75% | |======================================================================| 100%library(tidyverse)
library(timetk)
load(file = tempf)
FFdata$`x_F-F_Research_Data_Factors`$monthly$Temp2 %>%
left_join(FFdata$`x_F-F_Momentum_Factor`$monthly$Temp2, by="date") %>%
left_join(FFdata$`x_F-F_LT_Reversal_Factor`$monthly$Temp2,by="date") %>%
left_join(FFdata$`x_F-F_ST_Reversal_Factor`$monthly$Temp2,by="date") %>% head()
#> # A tibble: 6 × 8
#> date Mkt.RF SMB HML RF Mom LT_Rev ST_Rev
#> <yearmon> <dbl> <dbl> <dbl> <dbl> <dbl> <dbl> <dbl>
#> 1 Jul 1926 2.96 -2.56 -2.43 0.22 NA NA -1.87
#> 2 Aug 1926 2.64 -1.17 3.82 0.25 NA NA 1.43
#> 3 Sep 1926 0.36 -1.4 0.13 0.23 NA NA -0.17
#> 4 Oct 1926 -3.24 -0.09 0.7 0.32 NA NA -2.11
#> 5 Nov 1926 2.53 -0.1 -0.51 0.31 NA NA 1
#> 6 Dec 1926 2.62 -0.03 -0.05 0.28 NA NA 2.01FFfive <- FFdata$`x_F-F_Research_Data_Factors`$annual$`annual_factors:_january-december` %>%
left_join(FFdata$`x_F-F_Momentum_Factor`$annual$`january-december` ,by="date") %>%
left_join(FFdata$`x_F-F_LT_Reversal_Factor`$annual$`january-december`,by="date") %>%
left_join(FFdata$`x_F-F_ST_Reversal_Factor`$annual$`january-december` ,by="date")
FFfive %>% head()
#> # A tibble: 6 × 8
#> date Mkt.RF SMB HML RF Mom LT_Rev ST_Rev
#> <yearmon> <dbl> <dbl> <dbl> <dbl> <dbl> <dbl> <dbl>
#> 1 Dec 1927 29.5 -2.04 -4.54 3.12 24.1 NA -17.7
#> 2 Dec 1928 35.4 4.51 -6.17 3.56 29.1 NA -10.8
#> 3 Dec 1929 -19.5 -30.7 11.7 4.75 21.1 NA -15.0
#> 4 Dec 1930 -31.2 -5.17 -11.5 2.41 25.7 NA -0.86
#> 5 Dec 1931 -45.1 3.7 -14.0 1.07 23.8 -3.24 24.2
#> 6 Dec 1932 -9.39 4.4 11.1 0.96 -21.8 9.27 30.5FFfive %>%
pivot_longer(Mkt.RF:ST_Rev,names_to="FFVar",values_to="FFret") %>% mutate(FFret=FFret/100,date=as.Date(date)) %>%
filter(date>="1960-01-01",!FFVar=="RF") %>% group_by(FFVar) %>% arrange(FFVar,date) %>%
mutate(FFret=ifelse(date=="1960-01-01",1,FFret),FFretv=cumprod(1+FFret)-1) %>%
ggplot(aes(x=date,y=FFretv,col=FFVar,type=FFVar)) + geom_line(lwd=1.2) + scale_y_log10() +
labs(title="FF5 Factors plus Momentum", subtitle="Cumulative wealth plots",ylab="cum. returns") +
scale_colour_viridis_d("FFvar") +
theme_bw() + theme(legend.position="bottom")
#> Warning in self$trans$transform(x): NaNs produced
#> Warning: Transformation introduced infinite values in continuous y-axis
#> Warning: Removed 11 rows containing missing values (`geom_line()`).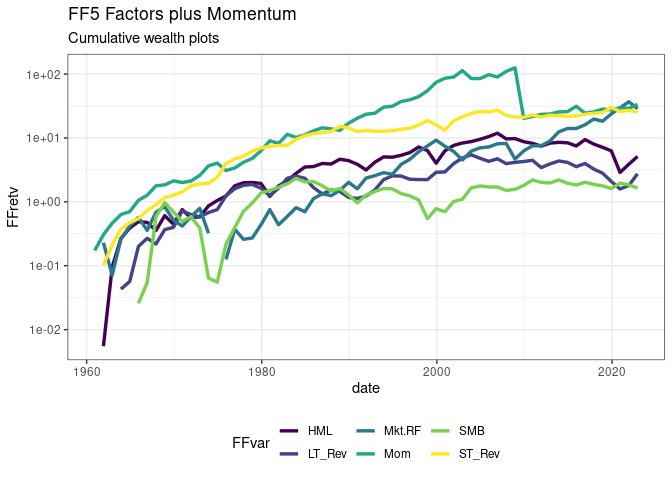
I am grateful to Kenneth French for providing all this great research data on his website! Our lives would be so much harder without this boost for productivity. I am also grateful for the kind conversation with Kenneth with regard to this package: He appreciates my work on this package giving others easier access to his data sets!